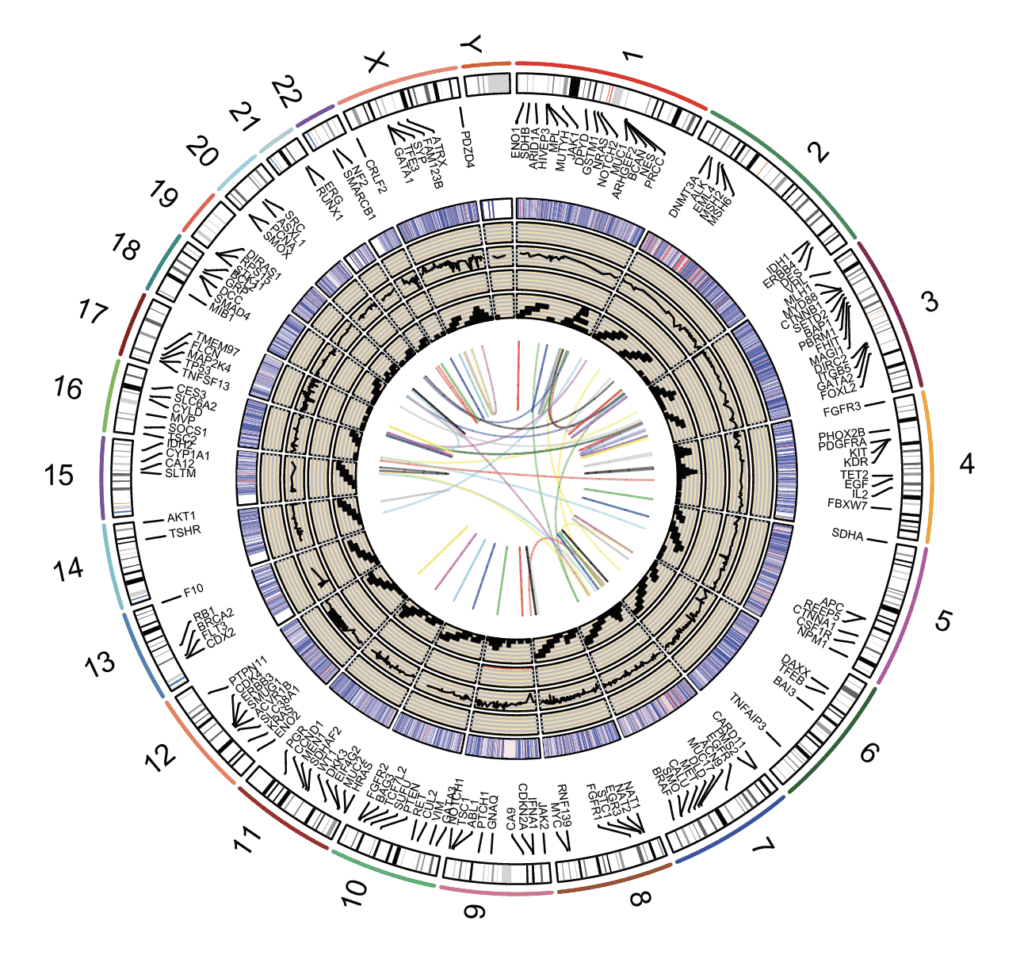
RCircos1 can be used to make chromosome ideograms. The example below uses the hg19 assembly (GRCh37) as reference. However, the newer (hg38 / GRCh38) can also be downloaded, manipulated and used instead. It is important to use the appropriate reference assembly when working with genomic data.
Install / open the package and create a default plot using the build in data with different tracks as example (data are printed out for clarity):
BiocManager::install('RCircos')

# RCircos, to make circos plots for genomic data
library(RCircos)
data(UCSC.HG19.Human.CytoBandIdeogram)
cyto.info <- UCSC.HG19.Human.CytoBandIdeogram
head(cyto.info)
  Chromosome ChromStart ChromEnd   Band  Stain
1       chr1          0  2300000 p36.33   gneg
2       chr1    2300000  5400000 p36.32 gpos25
3       chr1    5400000  7200000 p36.31   gneg
4       chr1    7200000  9200000 p36.23 gpos25
5       chr1    9200000 12700000 p36.22   gneg
6       chr1   12700000 16200000 p36.21 gpos50

RCircos.Set.Core.Components(cyto.info, chr.exclude = NULL, tracks.inside = 10, tracks.outside = 0)
RCircos.Core.Components initialized.
Type ?RCircos.Reset.Plot.Parameters to see how to modify the core components.

# initiallize graphic devide
dev.new()
# set plot area with default values:
RCircos.Set.Plot.Area()
# plot the chromosome ideogram:
RCircos.Chromosome.Ideogram.Plot()

# plot the connectors and gene names on the 1st and 2nd track
# gene names are held in the 4th column
data(RCircos.Gene.Label.Data)
head(RCircos.Gene.Label.Data)
  Chromosome chromStart chromEnd   Gene
1       chr1    8921418  8934967   ENO1
2       chr1   17345375 17380514   SDHB
3       chr1   27022894 27107247 ARID1A
4       chr1   41976121 42501596 HIVEP3
5       chr1   43803519 43818443    MPL
6       chr1   45794977 45805926  MUTYH

RCircos.Gene.Connector.Plot(RCircos.Gene.Label.Data, track.num = 1, side = "in")
Not all labels will be plotted.
Type RCircos.Get.Gene.Name.Plot.Parameters()
to see the number of labels for each chromosome.
RCircos.Gene.Name.Plot(RCircos.Gene.Label.Data, name.col = 4, track.num = 2, side = "in")
Not all labels will be plotted.
Type RCircos.Get.Gene.Name.Plot.Parameters()
to see the number of labels for each chromosome.

# heatmap plot on the 5th track and data values on the sixth
data(RCircos.Heatmap.Data)
head(RCircos.Heatmap.Data)
  Chromosome chromStart chromEnd GeneName  X786.O     A498 A549.ATCC    ACHN   BT.549  CAKI.1
1       chr1     934341   935552     HES4 6.75781  7.38773   6.47890 6.05517  8.85062 7.00307
2       chr1     948846   949919    ISG15 7.56297 10.49590   5.89893 7.58095 12.08470 7.81459
3       chr1    1138887  1142089 TNFRSF18 4.69775  4.55593   4.38970 4.50064  4.47525 4.47721
4       chr1    1270657  1284492     DVL1 7.76886  7.52194   6.87125 7.03517  7.65386 7.69733
5       chr1    1288070  1293915    MXRA8 4.49805  4.72032   4.62207 4.58575  5.66389 4.93499
6       chr1    1592938  1624243 SLC35E2B 8.73104  8.10229   8.36599 9.04116  9.24175 9.89727
RCircos.Heatmap.Plot(RCircos.Heatmap.Data, data.col = 6, track.num = 5, side = "in")

# scatterplot on the 6th track with data values on the fifth
# colours will be red for values >= 1 and blue for <= -1
data(RCircos.Scatter.Data)
head(RCircos.Scatter.Data)
  chromosome   start     stop num.mark seg.mean
1       chr1   61735   228706       18  -0.4459
2       chr1  228729   356443       10   0.5624
3       chr1  356542   564621        4  -0.9035
4       chr1  603590  1704138      227   0.3545
5       chr1 1709023  1711414        6   1.2565
6       chr1 1714558 12862252     6276   0.4027
RCircos.Scatter.Plot(RCircos.Scatter.Data, data.col = 5, track.num = 6, side = "in")

# line plot on the 7th track with data values on the fifth
data(RCircos.Line.Data)
head(RCircos.Line.Data)
  chromosome    start     stop num.mark seg.mean
1          1    61735 16895627     8732   0.1797
2          1 16896821 17212714      105  -0.2117
3          1 17214822 25574471     5321   0.1751
4          1 25574707 25662212       37   0.5064
5          1 25663310 30741496     2400   0.1384
6          1 30741656 30745210        3  -1.4742
RCircos.Line.Plot(RCircos.Line.Data, data.col = 5, track.num = 7, side = "in")
Error in RCircos.Validate.Genomic.Data(genomic.data, "plot", genomic.columns) :
  Some chromosomes in plot data is not in ideogram.
# some data not in ideogram: error
# this is because the chromosome field has only the number, rather than chr1 (as above).
# this can easily be changed:
RCircos.Line.Data$chromosome <- paste("chr", RCircos.Line.Data$chromosome, sep = "")
head(RCircos.Line.Data)
  chromosome    start     stop num.mark seg.mean
1       chr1    61735 16895627     8732   0.1797
2       chr1 16896821 17212714      105  -0.2117
3       chr1 17214822 25574471     5321   0.1751
4       chr1 25574707 25662212       37   0.5064
5       chr1 25663310 30741496     2400   0.1384
6       chr1 30741656 30745210        3  -1.4742
# try again
RCircos.Line.Plot(RCircos.Line.Data, data.col = 5, track.num = 7, side = "in")

# histogram on the 8th track with data values in the fourth column
data(RCircos.Histogram.Data)
head(RCircos.Histogram.Data)
  Chromosome chromStart chromEnd     Data
1       chr1   45000000 49999999 0.070859
2       chr1   55000000 59999999 0.300460
3       chr1   60000000 64999999 0.125421
4       chr1   70000000 74999999 0.158156
5       chr1   75000000 79999999 0.163540
6       chr1   80000000 84999999 0.342921
RCircos.Histogram.Plot(RCircos.Histogram.Data, data.col = 4, track.num = 8, side = "in")

# tile plot on the 9th track
data(RCircos.Tile.Data)
head(RCircos.Tile.Data)
  Chromosome chromStart  chromEnd
1       chr1          0  23900000
2       chr1   12700000  44100000
3       chr1   28000000  68900000
4       chr1   59000000  94700000
5       chr1   99700000 120600000
6       chr1  147000000 234700000
RCircos.Tile.Plot(RCircos.Tile.Data, track.num = 9, side = "in")
Tiles plot may use more than one track. Please select correct area for next track if necessary.

# Link line plot on the 9th track
data(RCircos.Link.Data)
head(RCircos.Link.Data)
  Chromosome chromStart  chromEnd Chromosome.1 chromStart.1 chromEnd.1
1       chr1    8284703   8285399         chr1      8285752    8286389
2       chr1   85980143  85980624         chr7    123161313  123161687
3       chr1  118069850 118070319         chr1    118070329  118070689
4       chr1  167077258 167077658         chr1    169764630  169764965
5       chr1  171671272 171671550         chr1    179790879  179791292
6       chr1  174333479 174333875         chr6    101861516  101861840
RCircos.Link.Plot(RCircos.Link.Data, track.num = 11, by.chromosome = FALSE)
Depending on the speed of your computer, it may take some time for the plot to be draw:
