As described, a regression line was fitted through 30 data points in the trees30.rda data set.
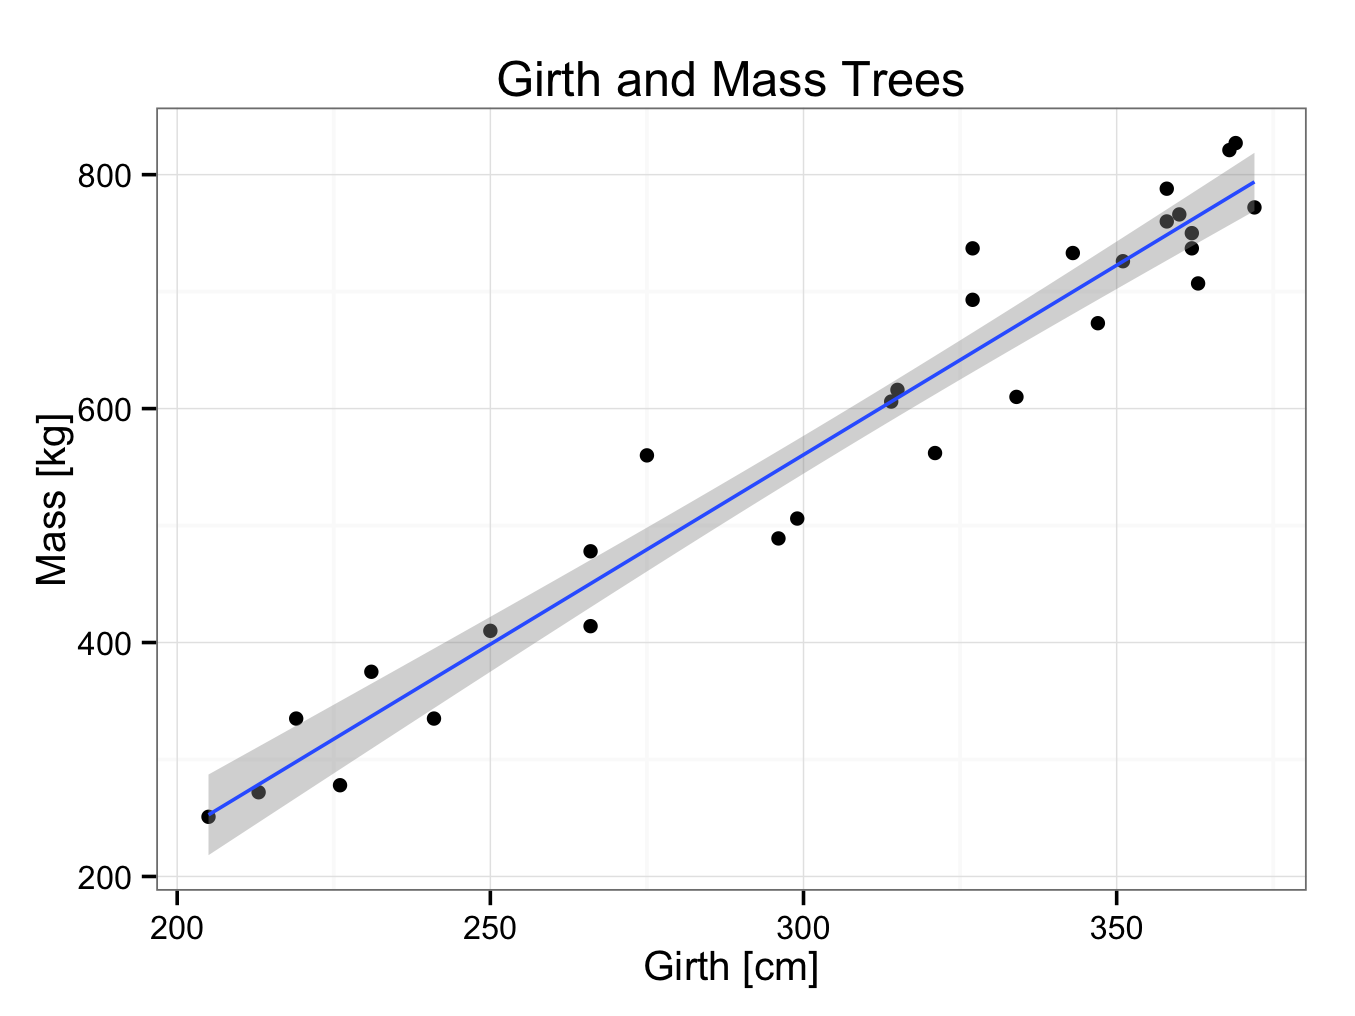
As can be seen in the graph, the line seems to fit the data well. However, the fit is not always as good as illustrated here. It would be nice to have a measure of how close the line fits the data. This measure is called the correlation coefficient and often denoted by R. It is defined as:
Obviously, computers are commonly used to calculate the correlation coefficient. In the tree example, the correlation coefficient can be found:
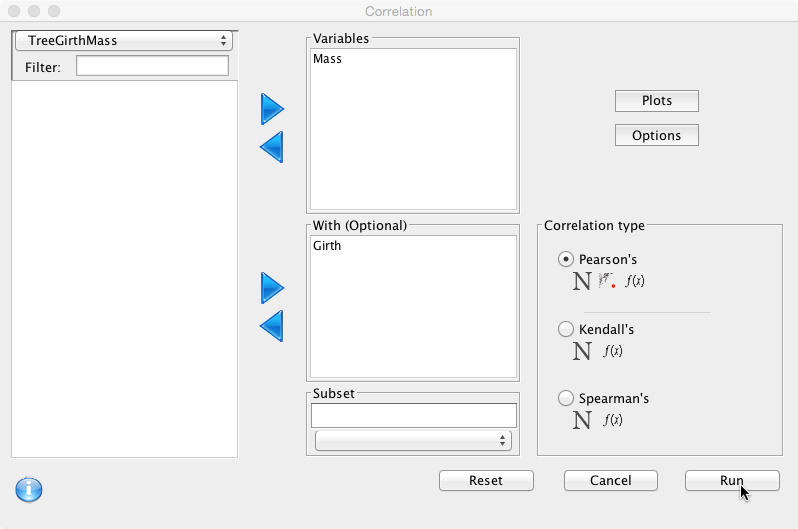
1: Using the GUI interface, by selecting Analysis and then Correlation:

As Variable select Mass and under With (Optional) select Girth. Under Correlation Type, select Pearson’s (Spearman is a ranked correlation coefficient used to demonstrate a trend rather than linearity).
 Plots can be added with options for the confidence level.:
 Hit Run::
This should create a plot and the following console output:
corr.mat<-cor.matrix(variables=d(Mass), with.variables=d(Girth), data=TreeGirthMass, test=cor.test, method=’pearson’,alternative=”two.sided”)
print(corr.mat)
Pearson’s product-moment correlation
Mass
Girth cor 0.9731
N 30
CI* (0.9437,0.9873)
stat** 22.37 (28)
p-value 0.0000
————
** t (df)
* 95% percent interval
HA: two.sided
qscatter_array(d(Mass), d(Girth), data=TreeGirthMass) + geom_smooth(method=”lm”)
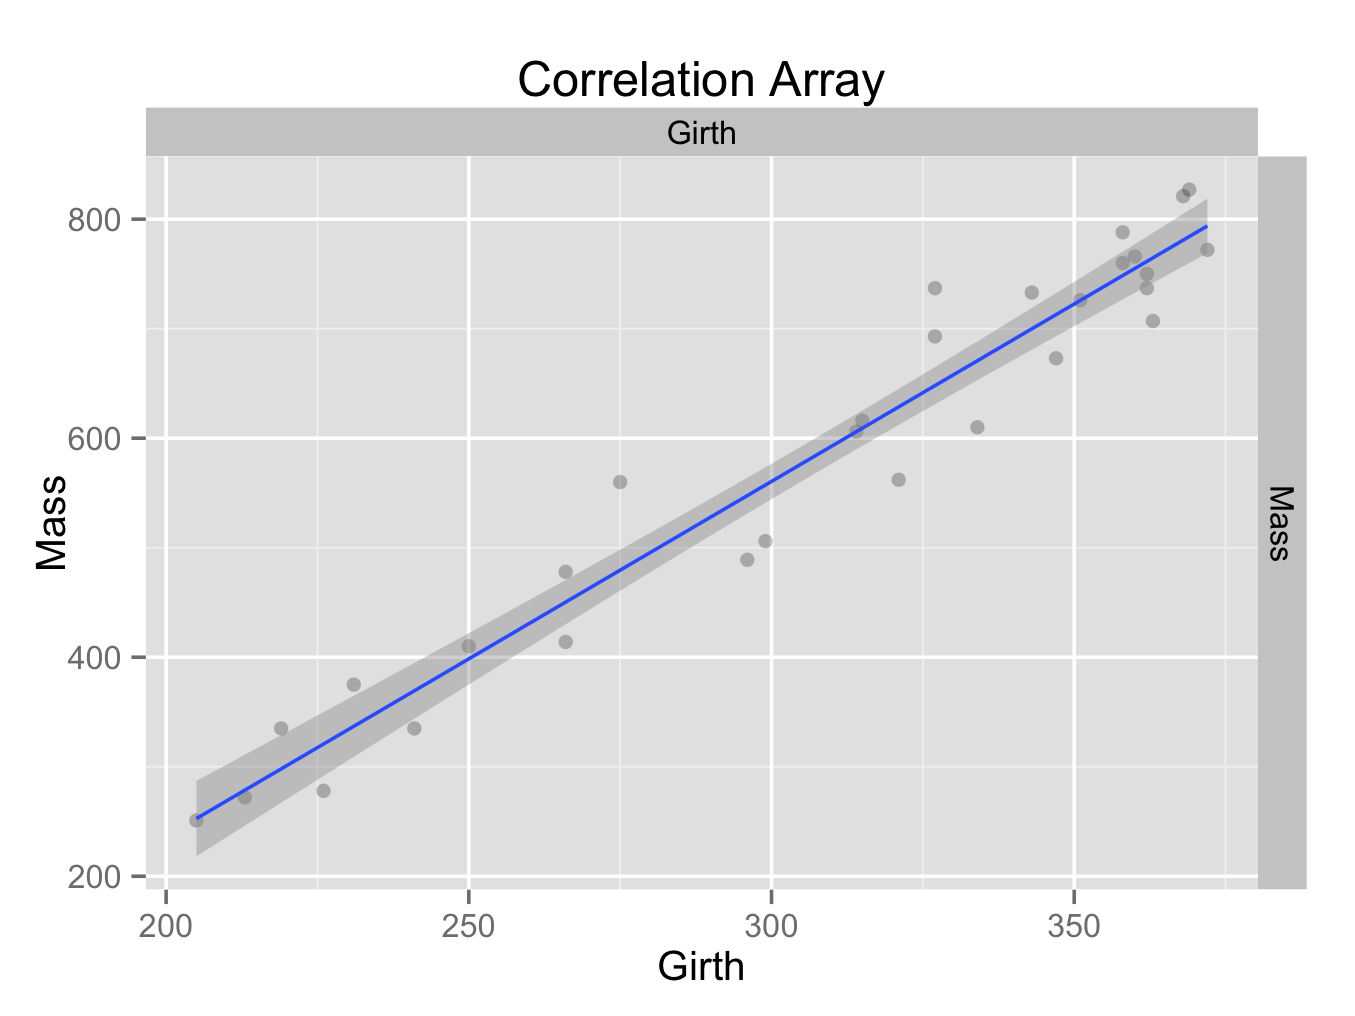 Plot builder can be used to create a similar, but more versatile plot.
2: Or directly in the console:
cor(TreeGirthMass$Girth,TreeGirthMass$Mass,method=’pearson’)
[1] 0.9731369
The correlation coefficient therefore is 0.9731 with a 95% confidence interval of (0.9437, 0.9873). The p-value for the test of no association is 0.0000 and therefore highly significant. It is concluded there is an association between the girth and mass of the trees. How good this association is, is indicated by the correlation coefficient.
The correlation coefficient always has a value between –1 and 1. A correlation coefficient of 0.97 therefore, means that there is an excellent correlation between the girth and mass of a tree (it should be noted that the square of the correlation coefficient is always smaller than the correlation coefficient itself; this is because the square of a number between –1 and 1 is always smaller than the number itself).
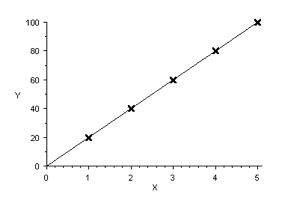
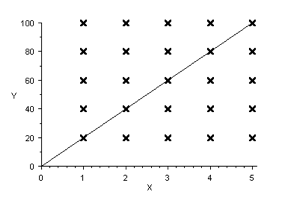
If the correlation coefficient = 1, the line fits the data perfectly:
 A correlation coefficient of zero means that there is no correlation whatsoever:
 In fact, we could have drawn any line through the data points above! A correlation coefficient of –1, means that there is reverse relation between the data.
The correlation coefficient is a measure how close the line fits the data. It ranges from –1 to +1. A correlation coefficient of zero means that there is no correlation. The more the value approaches 1, the better the line fits the data. A negative value corresponds to a reverse relation.
Causation
Correlation may be demonstrated statistically. However, this does not necessarily demonstrate a cause (causation). Hill1 described the criteria for causation:
- strength
- consistency
- specificity
- temporality
- biological gradient
- plausibility
- experiment
- analogy