One of the main strengths of JGR is the incorporation of plot builder with the ggplot2 library. The GUI makes it easy to create standard statistical plots provided the variables are appropriately declared. The following example illustrates how to create a scatter plot using the trees data set. The data set contains data regarding the girth and weight of 104 trees. Both variables are numeral.
Open the data set and, with the Console the active window as described, select Plots and then Plot Builder from the menu bar. The following window is shown: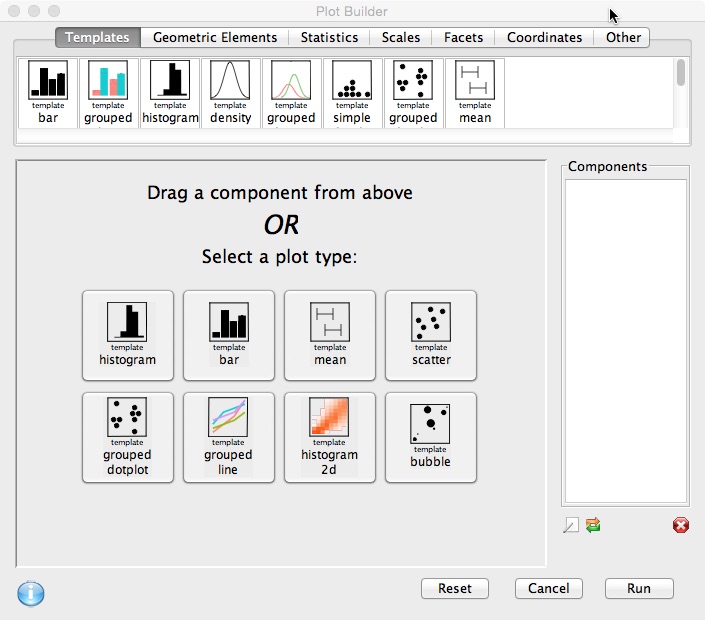 Find the scatter plot template icon and drag it into the components window:
 The dialogue requests the variables that need to be plotted. It is customary to plot the independent variable on the x-axis (abscissa) and the dependent variable on the y-axis (ordinate).
 The plot will become visible in the preview window.
 The plot will look better with a black and white theme, title and axes labels. To apply a black and white theme, go to the ‘other’ tab and drag the bw template icon into the components window.
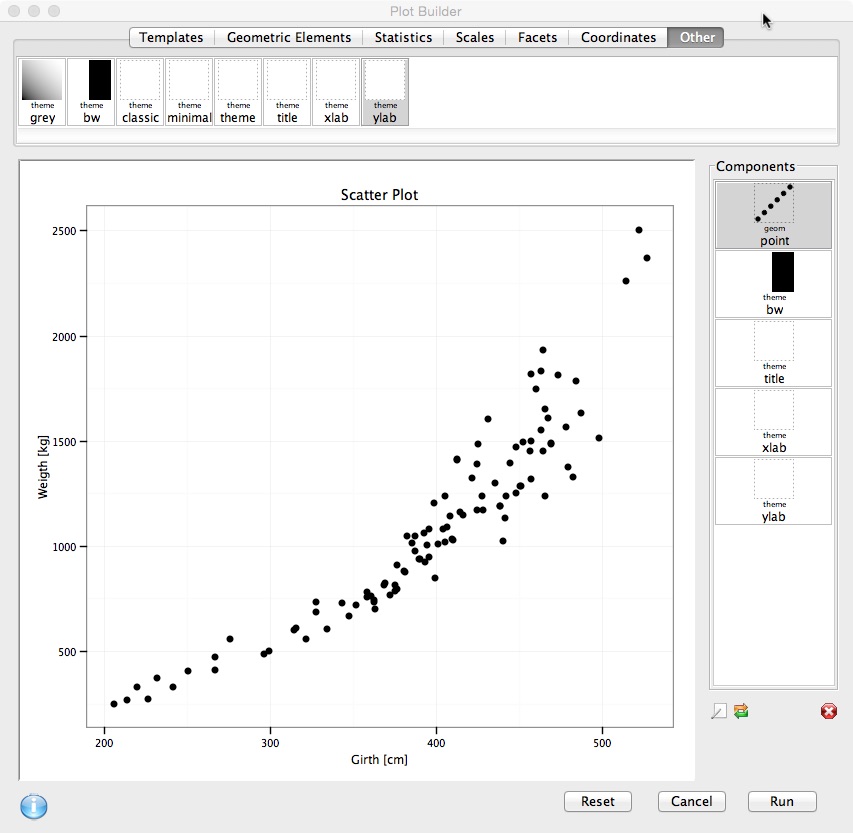
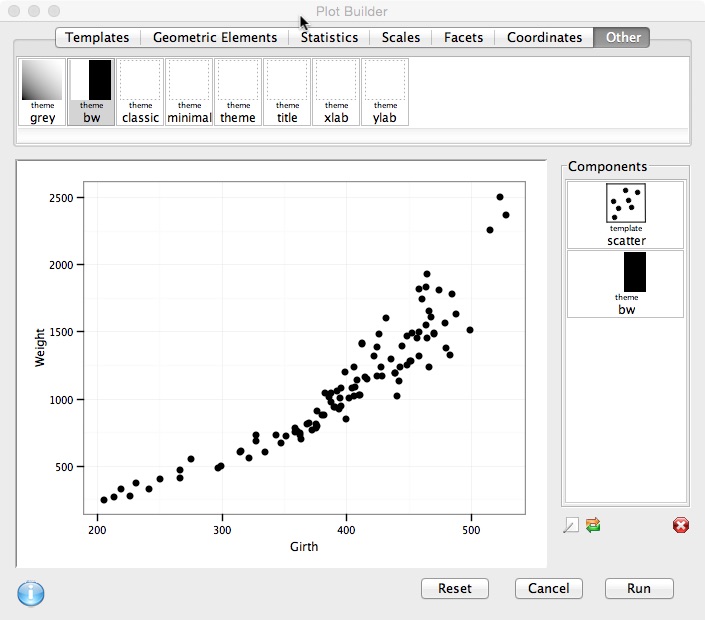 The preview window shows that the black and white theme has been applied. To apply a title, drag the title icon into the components window. Double click on the title icon to show the settings tab. Give the plot a title, for example ‘Scatter Plot’ and click apply.
 Similarly, labels for the x-axis and y-axis can be set.
The plot can be further customised by ‘right clicking’ on the scatter plot template icon and selecting ‘break out‘. This will split the scatter plot template in its components (the scatter plot icon changes to ‘geom point’).
 Right click on ‘geom point’ to show the different options. The shape of the data points has been changed to size 18 diamonds and the colour of the outline and fill to red.
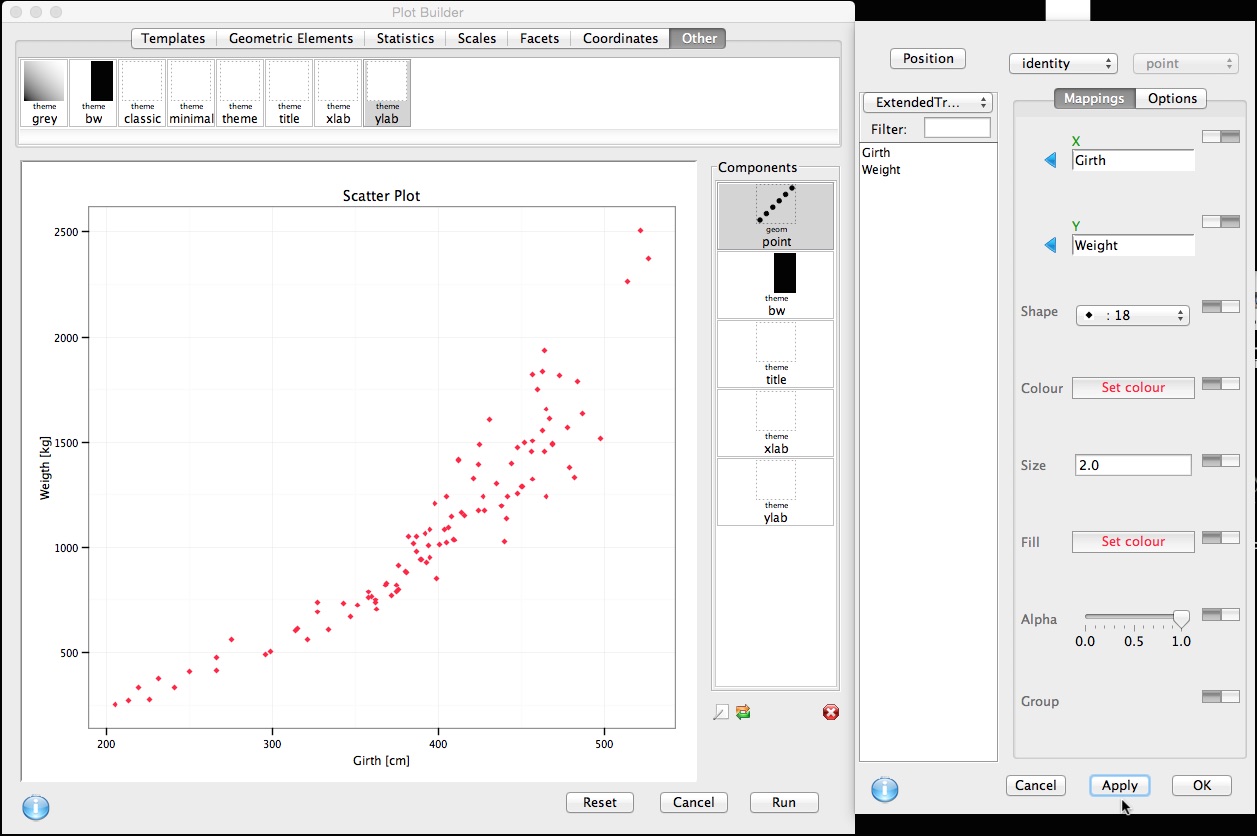 Once satisfied with the plot, select Run to generate the plot (in a new window).
 It can be time consuming to create several plots with the same lay-out but different data. Therefore, it is often preferable to create a template. To do this, in plot builder, select Tools and then Make Template. Give the template a name (ie MyTemplate) and select OK.
 All the different components of the plot will now be amalgamated into one template.
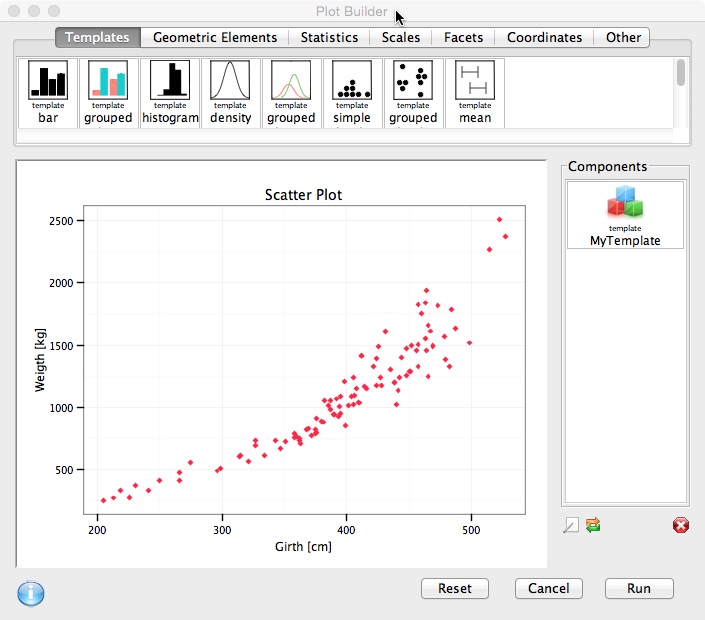 This template can also be saved by right clicking it and then select ‘Export template‘.
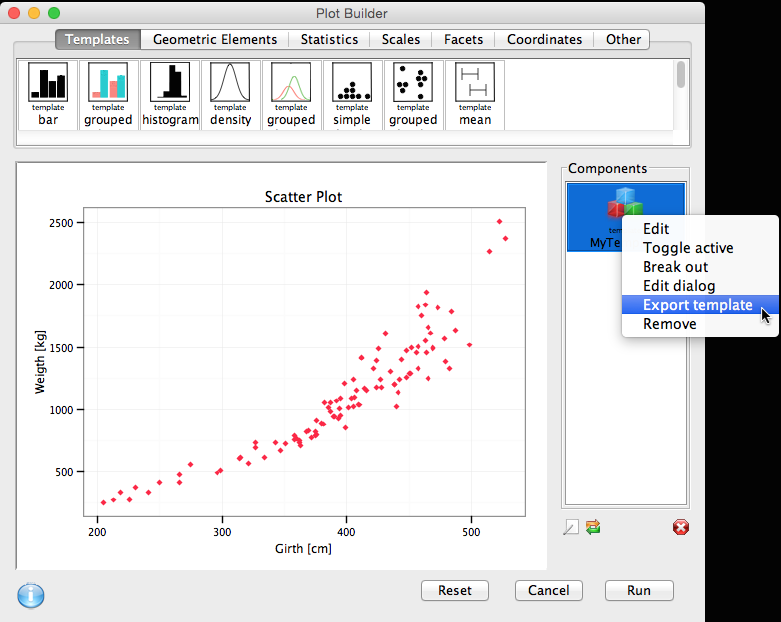 Give the template an appropriate name and save it in an appropriate location.