Essentially, there are two types of computer graphical files:
- Vector
- Raster
When considering what file type to use, it is worth remembering that professional printing presses have a higher resolution and are much less forgiving than any laser printer or monitor.
Raster Graphics
A raster image is made up of a finite number of pixels as in a photograph. It is possible to produce very high quality plots and diagrams as raster images by using a very large number of pixels. Many peer reviewed journals actually prefer these image types for submission. JPEG (Joint Photographic Experts Group), TIFF (Tagged Image File Format), BMP (BitMaP), PNG (Portable Network Graphics) and GIF (Graphics Interchange Format) are all examples of raster file formats. Obtaining quality images in raster format is limited by two factors:
- Number of pixels
- Compression
Number of pixels – more is better quality but larger file size
The number of pixels required to give smooth crisp curves and lines depends on the physical size of the image. It is therefore customary to express the resolution of an image in pixels per inch (cf Dots Per Inch or DPI in printing). Black and white images, graphs and diagrams should have a minimal resolution of 600 DPI, photographs should have a minimum resolution of 300 DPI.
Compression – lossless retains quality but has less compression
So called ‘lossless’ compression is a symmetrical type of file compression. A compression algorithm is used to reduce the file size, making it quicker as easier to transfer and store files. GIF and PNG are file types that use lossless compression. Because the compression is symmetrical, compressing and decompressing the file returns the exact original. The amount of compression that can be obtained however, is limited.
Lossy compression on the other hand is used in JPEG / JPG images. This is an ‘asymmetrical’ type of file compression. Massive compression is possible, but at a price. The decompressed image can never be the same as the original, resulting in loss of quality. This sacrifice is often difficult to perceive in photographs, but can be obvious in line diagrams, graphs and text. Some software allows the compression ratio to be set so that the user can decide on an acceptable quality for file size.
Vector Graphics
Vector images are not like photographs. Instead they are a mathematical description of the objects in the image. Examples of vector graphical files are Scalable Vector Graphics (SVG) and Portable Document Format (PDF, although PDF files can also contain raster graphics!). Rather than information about individual pixels, the file contains instructions to the computer of printer such as: ‘draw a circle with middle point (x,y), radius r, line colour blue, line type solid etc’. The printer or computer can then render the image at any resolution that it is capable of displaying. Vector graphics can be zoomed in without any loss of quality; they have an infinite resolution.
If you have a choice, always choose a vector file format for plots and diagrams. Vector graphics can always be converted into raster images if so required. It is however not possible, for practical purposes, to convert raster to vector images.
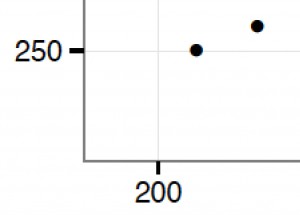
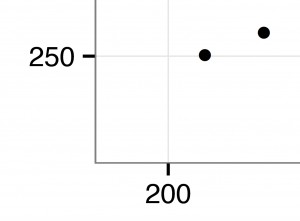
Unlike raster images, when vector images are zoomed in, there is no loss of quality. The plot below was created with plot builder and saved as a TIFF and PDF file. Both images were zoomed to 800%. It can clearly be seen that the TIFF has loss of definition, but there is no loss of quality in the PDF file.
TIFF zoomed 800%
PDF zoomed 800%
SVG file created with R (ggvis 1):


