Once statistical analysis has been performed, the results will usually have to be collated into a report that is written with the aid of a word processor (such as Microsoft Word or Open Office). Basically, JGR gives two types of output:
- Text
- Plots or graphs
Text
The easiest way to insert the console output into a word processor is to select it, copy it (Ctrl-C) and paste it (Ctrl-V) into the word document. However, it is important to bear in mind that the console uses a so-called ‘mono-spaced’ font; each character occupies the same amount of space in the horizontal and vertical directions (for example the i and w take the same space). The majority of fonts used by word processors however, are proportionally spaced; each character’s width depends on its size (for example the i takes up less space than the w). Consequently, the formatting of the content can change in unexpected ways when it is pasted into a word processor.
For example, consider the console output below:
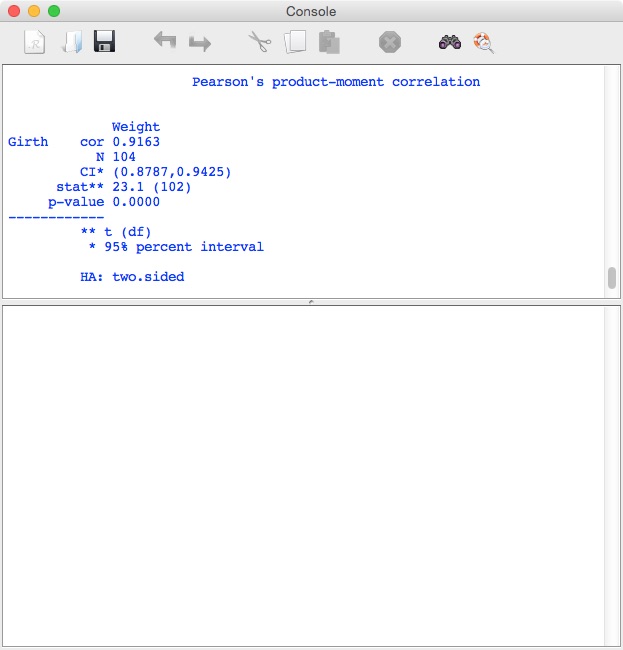
The console output was pasted into Microsoft Word in ‘Arial’ font: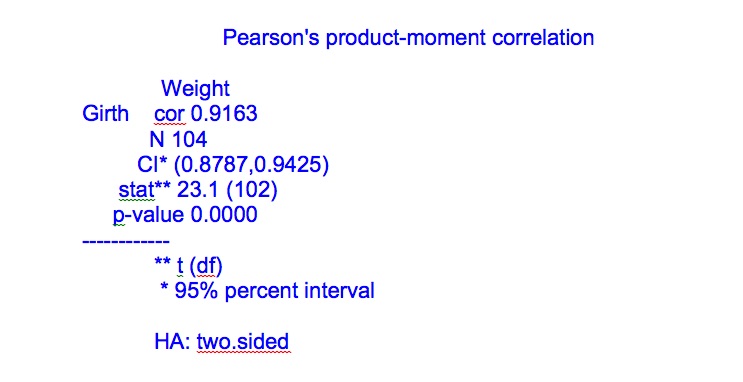 It can be seen that a significant amount of re-formatting will be required to re-establish the columns of the original. However, simply changing the font to a mono-spaced font will correct the formatting. For example, if the font is changed to ‘Ansdale Mono':
Plots and Graphics
Computer graphical files can be divided into two groups: vector graphics and raster graphics. These different types are further discussed here. In general, it is preferable to save graphical diagrams or plots as vector graphics (SVG or PDF) as they are infinitely scalable without loss of quality. However, some journals prefer raster files such as JPG and this may ultimately depict the choice of file type.
Consider the following scatter plot that has been created with plot builder: 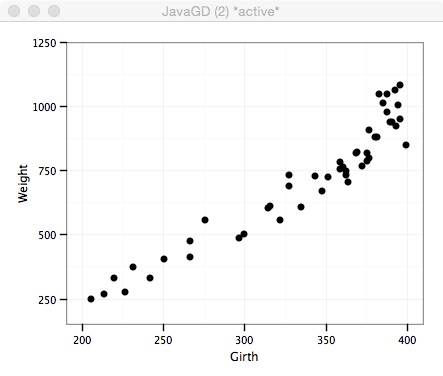 It is best to save the plot as a separate file with an appropriate name that can subsequently be imported into a word processor. If a raster file is used (TIFF, BMP or JPG), the plot may need to be re-scaled and the best time to change the physical size of the plot is when it has been created. JGR / R will re-plot the data to fit the window whilst keeping the font sizes, axis scale and plot points consistent. Click and drag the bottom right corner of the plot window to obtain the required proportion and size:
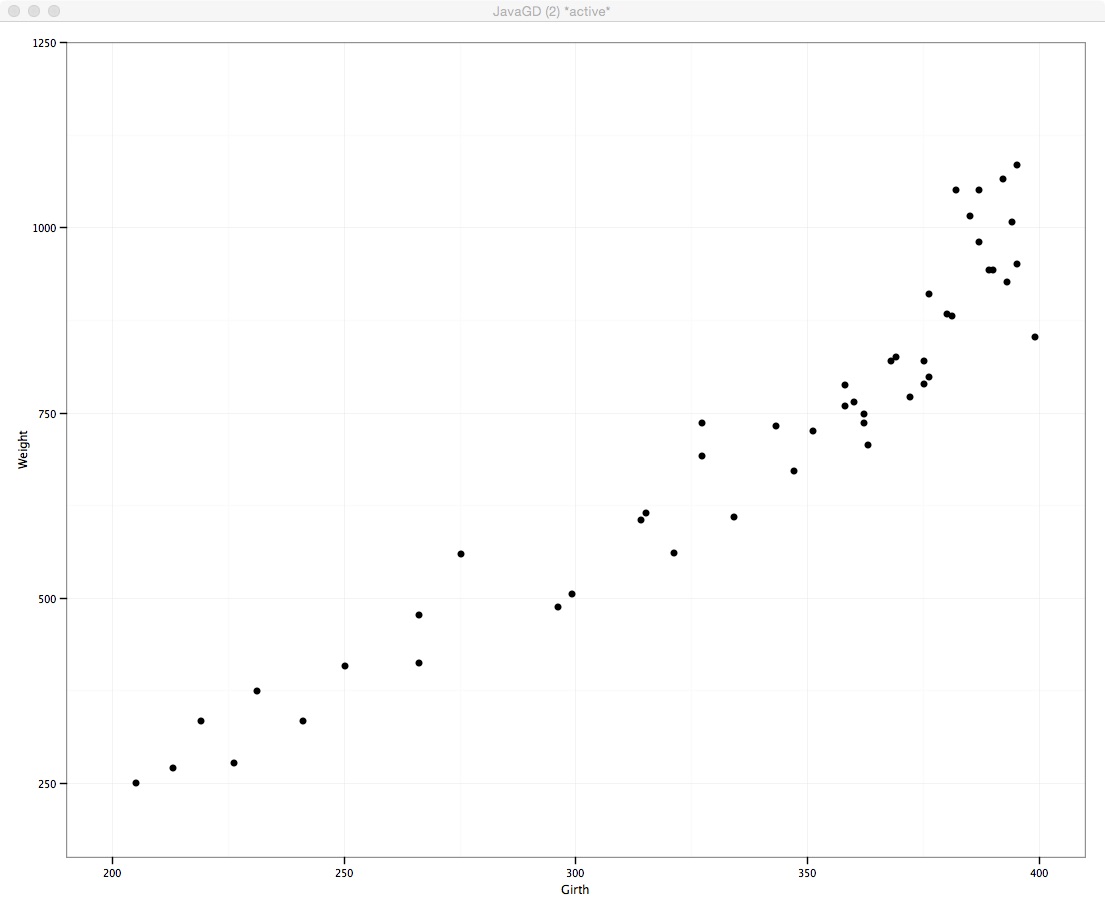
The plot can subsequently be saved with an appropriate name by selecting File and the required file type.  If the plot is to be saved as a vector file (SVG or PDF), there is no need to rescale the plot before saving it as vector files are infinitely scalable.
PDF files can be opened with Adobe Acrobat Viewer that is available for all operating systems. By zooming a PDF file, it can be seen that it is a vector file as there is no loss of quality.
Microsoft Windows lacks the powerful features of MacOS for manipulating and converting PDF and EPS files. In MacOS, a PDF file can easily be ‘dragged and dropped’ into a Word for Mac document. The Windows operating system is not so straight forward to use and it may be easier to import a plot as an appropriately scaled raster file rather than a vector file.
Always keep a separate copy of any graphical plot your created just in case your publisher doesn’t accept embedded graphics!
Alternatively, a ‘quick and dirty’ approach is to select Edit and Copy (as image) in the plot window and Paste the diagram into a word processor. This will insert a low quality raster image into your document. The quality is generally OK for viewing at home, but insufficient for printing high quality illustrations (as required by journals).
Microsoft Word does not ‘play fair’ with images pasted into it. If you subsequently copy the image to move it to another location, it will result in a VERY low quality image that is not good enough for any serious use.