Receiver operating characteristics (ROC) plots are used to show the performance of a classifier. For example the Mirels’ score (integer value between 4 and 12) may be used as a classifier for fracture (binary).
Mirels’ score
| Location | Size | Appearance | Pain | Points |
|---|---|---|---|---|
| Upper | < 1/3 | Blastic | Mild | 1 |
| Lower | 1/3 - 2/3 | Mixed | Moderate | 2 |
| Peritroch. | > 2/3 | Lytic | Severe | 3 |
Download the plotroc.rda dataset for this example. The data frame is called plotroc and has two variables: mirel (the mirels’ score) and fracture (fracture yes / no). The package ROCR 1 should be installed to create the plot:
library(ROCR)
mirel.pred<-prediction(plotroc$mirel,plotroc$fracture)
mirel.perf<-performance(mirel.pred,’tpr’,’fpr’)
To show the plot with a title:
plot(mirel.perf,main=’ROC curve – Mirels Score’)
This plot shows the performance of the classifier (Mirels’ score) with the false positive rate on the x-axis and the true positive rate on the y-axis. The line of ‘chance’ is a diagonal from the origin to (1,1). To add this line:
abline(0,1)
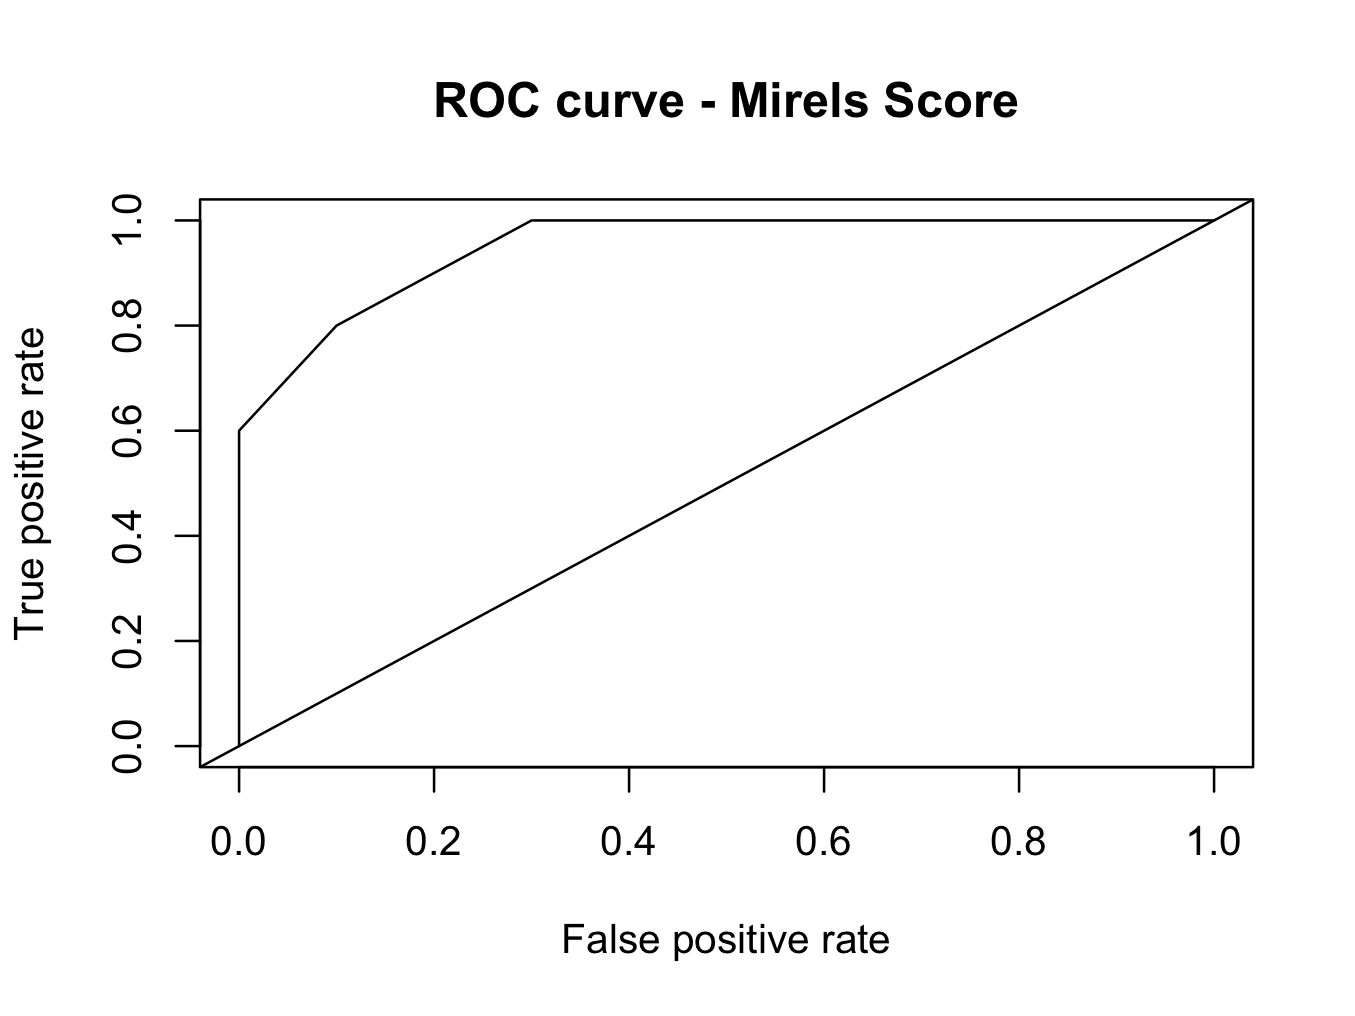
A classifier should be above this line of chance (a classifier that is below the diagonal line is usually redefined so it becomes ‘positive’ rather than ‘negative’). The larger the area under the curve, the better the classifier. To calculate the area under the curve (auc):
auc<-performance(mirel.pred,’auc’)
auc<-unlist(auc@y.values)
auc
[1] 0.95
An area under the curve of 95% indicates good performance as a classifier 2.
The optimum value of the classifier is that value that maximises true positives whilst minimising false positives. Youden’s index can be helpful in finding the optimum value 3. However, the chosen value also depends on the clinical relevance. In the example, all patients with a Mirels’ score of 10 or above had a fracture. Of the 3 patients with a score of 9, 2 had a fracture; whilst 2 out of 4 patients with a score of 8 had a fracture. None of the patients with a score of 7 had a fracture. A score of 8 seems clinically a better classifier as it is important not to miss an impending fracture.