Forest plots are commonly used to illustrate the result of a meta-analysis graphically.
Download the plottranexamic.rda dataset 1 for this example . http://www.bmj.com/content/344/bmj.e3054
This data set was also used to create a funnel plot to illustrate possible publication bias.
The data frame tranexamic contains the data of 87 studies and has five variables: Trial (author and year), TxE (number of events in the treatment group), TxN (number of observations in the treatment group), ControlE (number of events in the control group) and ControlN (number of events in the control group). The show the data:
tranexamic
(output omitted for brevity)
The package rmeta 2 should be installed to perform the analysis and create the plot:
library(rmeta)
metatran<-meta.MH(TxN,ControlN,TxE,ControlE,data=tranexamic,names=Trial)
metatran
Fixed effects ( Mantel-Haenszel ) Meta-Analysis
Call: meta.MH(ntrt = TxN, nctrl = ControlN, ptrt = TxE, pctrl = ControlE,
names = Trial, data = tranexamic)
Mantel-Haenszel OR =0.41 95% CI ( 0.37, 0.46 )
Test for heterogeneity: X^2( 75 ) = 129.01 ( p-value 1e-04 )
A more detailed analysis can be obtained:
summary(metatran)
Fixed effects ( Mantel-Haenszel ) meta-analysis
Call: meta.MH(ntrt = TxN, nctrl = ControlN, ptrt = TxE, pctrl = ControlE,
names = Trial, data = tranexamic)
————————————
OR (lower 95% upper)
Rybo 1972 NaN 0.00 NaN
Horrow 991 0.84 0.33 2.11
–
Kulkarni 2011 0.80 0.42 1.51
————————————
Mantel-Haenszel OR =0.41 95% CI ( 0.37,0.46 )
Test for heterogeneity: X^2( 75 ) = 129.01 ( p-value 1e-04 )
When different studies show different results, this can be due to chance (study homogeneity) or genuine differences (study heterogeneity). The Chi squared thest for hetetogeneity is significant 3. Overall, the odds ratio (Mantel Haenszel method) is 0.41 favouring treatment with tranexamic acid.
To show the plot:
plot(metatran)
This creates a large (scalable) plot. That has been omitted for clarity. To show a plot based on studies 10 to 25:
metatran2<-meta.MH(TxN,ControlN,TxE,ControlE,data=tranexamic,names=Trial, subset=c(10:25))
metatran2
Fixed effects ( Mantel-Haenszel ) Meta-Analysis
Call: meta.MH(ntrt = TxN, nctrl = ControlN, ptrt = TxE, pctrl = ControlE,
names = Trial, data = tranexamic, subset = c(10:25))
Mantel-Haenszel OR =0.34 95% CI ( 0.26, 0.45 )
Test for heterogeneity: X^2( 14 ) = 40.95 ( p-value 2e-04 )
A more detailed analysis can be obtained by:
summary(metatran2)
Fixed effects ( Mantel-Haenszel ) meta-analysis
Call: meta.MH(ntrt = TxN, nctrl = ControlN, ptrt = TxE, pctrl = ControlE,
names = Trial, data = tranexamic, subset = c(10:25))
————————————
OR (lower 95% upper)
Hiippala 1995 0.17 0.02 1.67
Katsaros 1996 0.35 0.16 0.74
Zonis l996 0.06 0.01 0.74
Benoni 1996 0.18 0.07 0.48
Shore-Lesserson 1996 0.12 0.01 1.14
Menichetti 1996 0.33 0.10 1.13
Katoh 1997 0.27 0.09 0.79
Hiippala 1997 0.09 0.03 0.31
Pinosky 1997 1.36 0.39 4.79
Brown 1997 0.21 0.08 0.55
Hardy 1998 1.26 0.52 3.05
Misfeld 1998 NaN 0.00 NaN
Sorin 1999 0.06 0.01 0.36
Jansen 1999 0.06 0.01 0.36
Nuttall 2000 0.52 0.22 1.24
Benoni 2000 3.07 0.75 12.59
————————————
Mantel-Haenszel OR =0.34 95% CI ( 0.26,0.45 )
Test for heterogeneity: X^2( 14 ) = 40.95 ( p-value 2e-04 )
This meta-analysis only includes studies 10 to 25 and the overall odds ratio is 0.34 favouring treatment with tranexamic acid.
The plot containing the meta-analysis of study 10 to 25:
plot(metatran2)
To add a title and indicate odds ratios that favour treatment or control group:
title(main=’Forest Plot Meta Analysis Tranexamic Acid’)
text(3,-21,”Favour Control”)
text(0.3,-21,”Favour Treatment”)
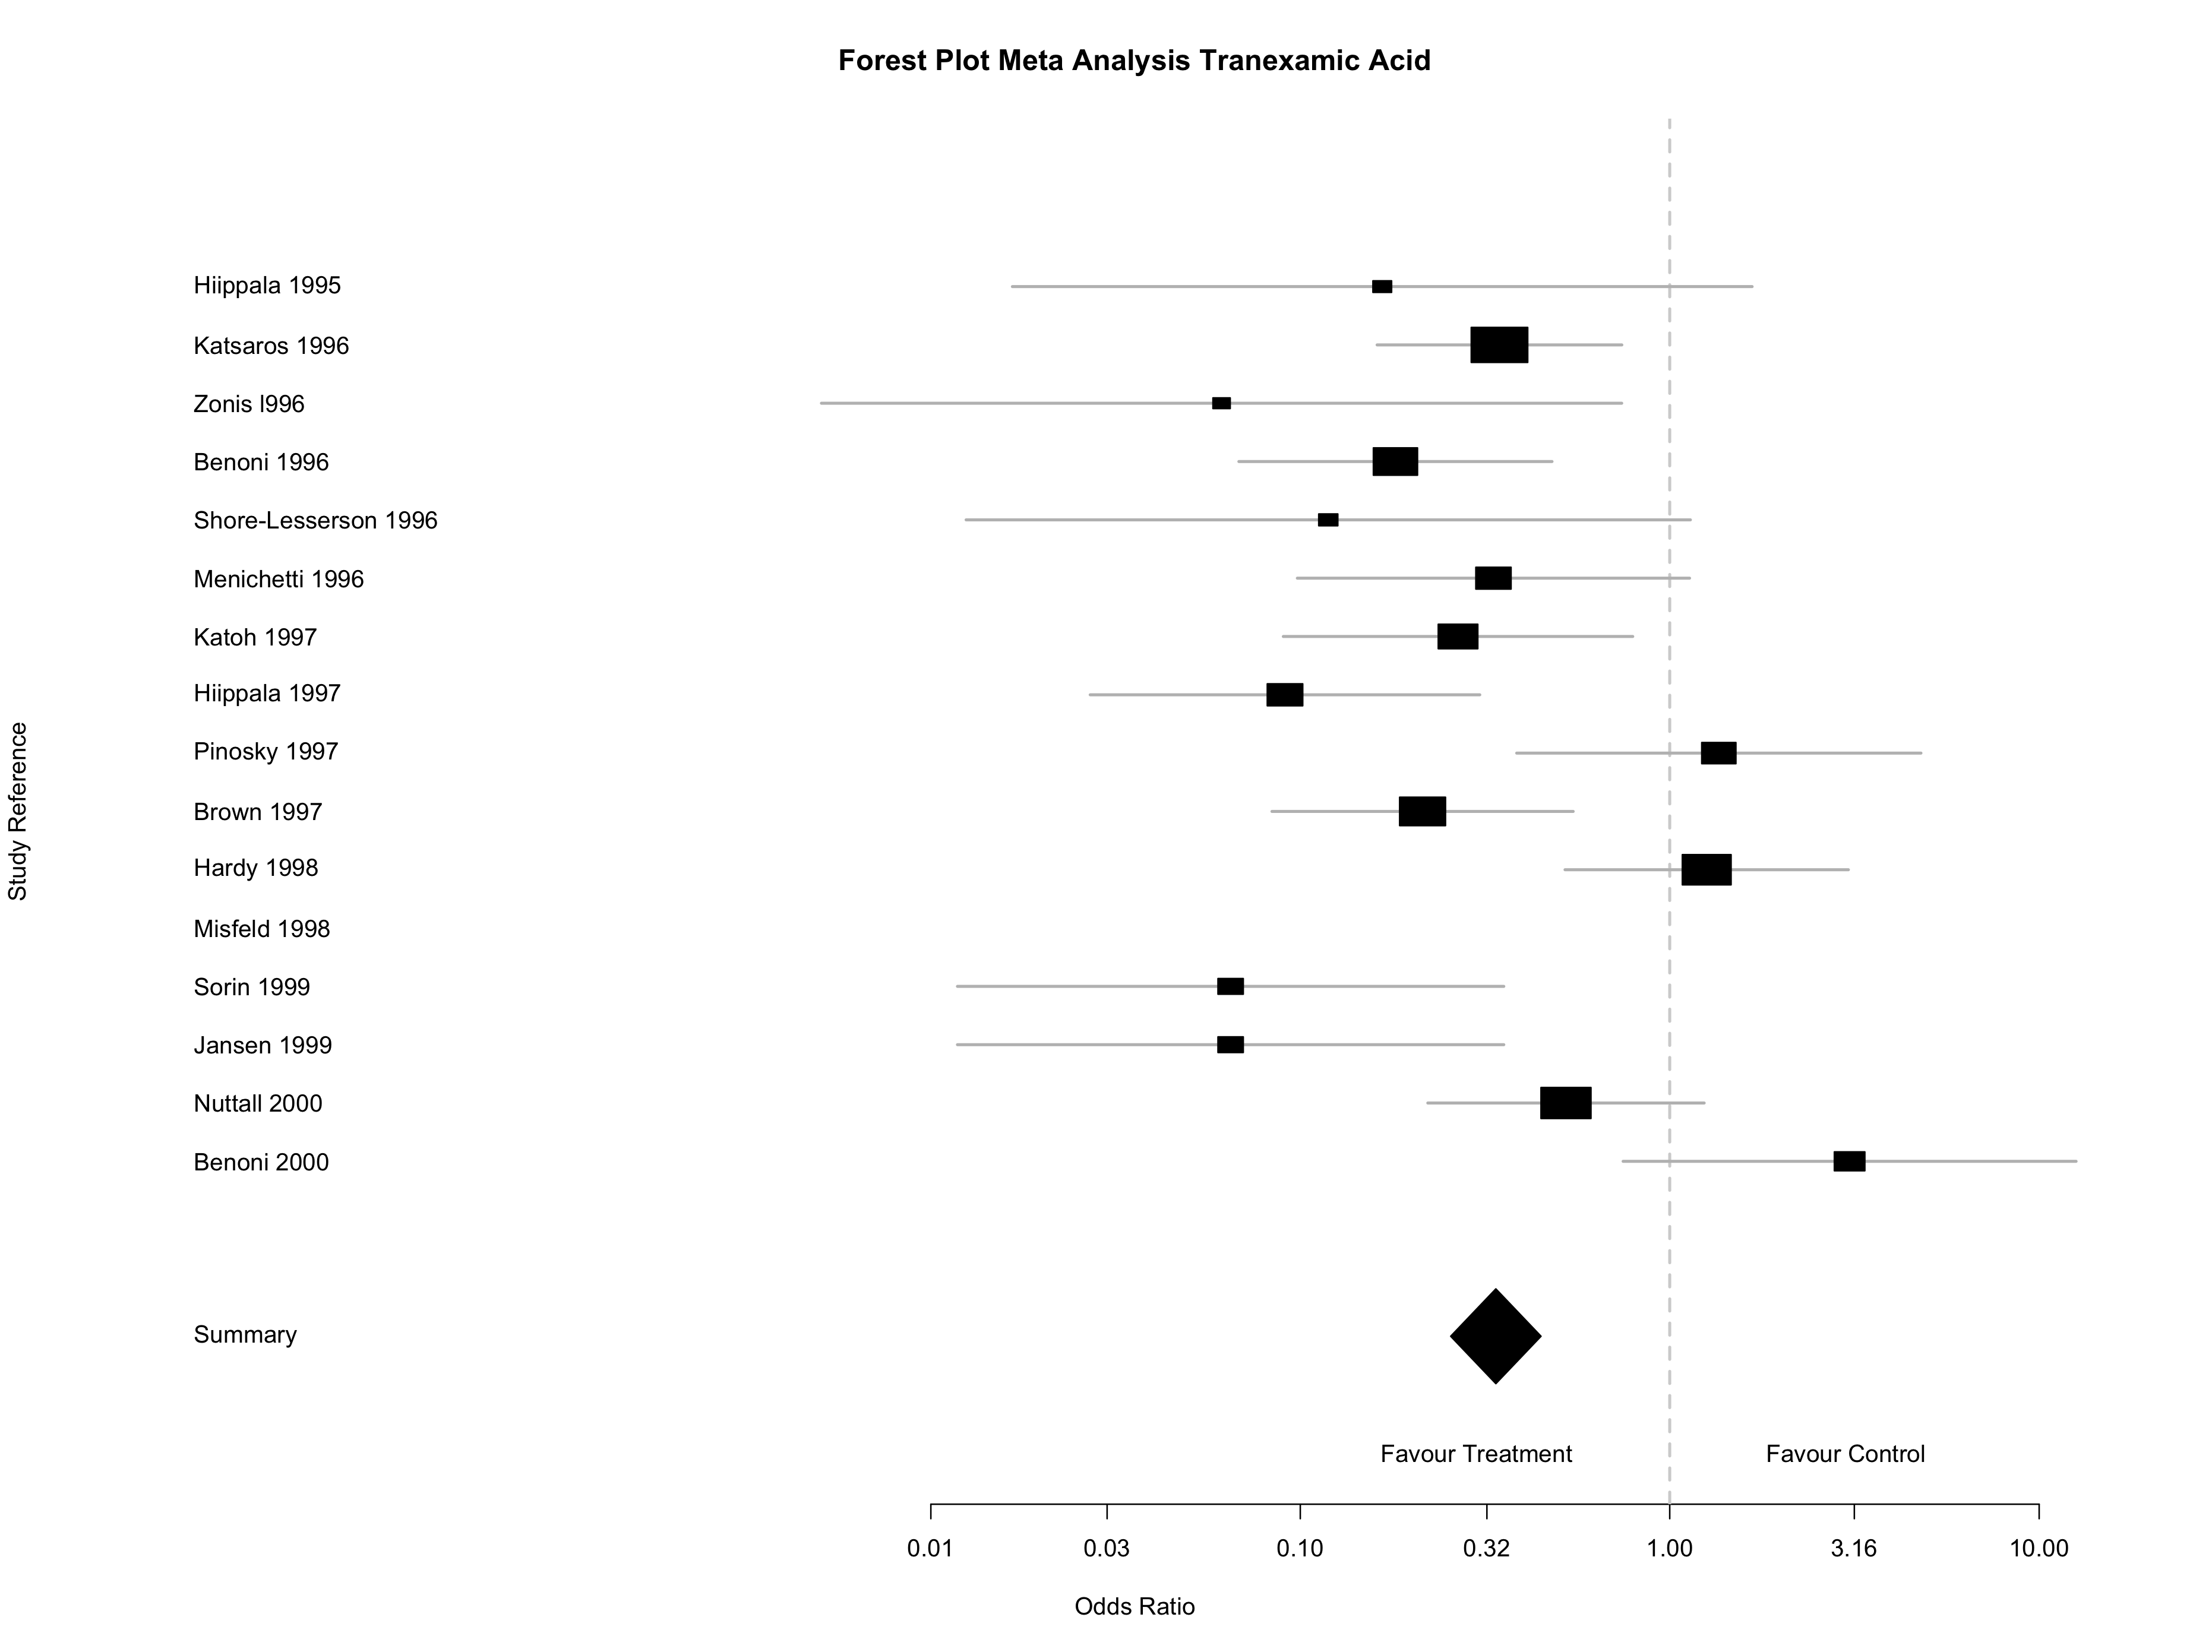
The large diamond at the bottom of the plot indicates the overall effect (odds ratio 0.34); favouring treatment with tranexamic acid. Individual studies are indicated on the y-axis. The effect of each study is indicated by a black rectangle. The vertical dotted reference line, indicates no effect (odds ratio 1.0). The larger the weight of the individual study, the larger the size of the rectangle. Studies with more weight have more patients and consequently narrower confidence intervals (indicated by the horizontal grey lines). The studies with wider confidence intervals contribute less to the overall effect and have smaller rectangles 4. Overall, 12 studies favoured treatment with tranexamic acid and 3 didn’t.