Bar charts are used to present ordinal, nominal or discrete numeral data. They are usually drawn so that the bars are vertical, but can also be drawn horizontally to aid readability. The bars (or bins) have a space between each other and don’t touch to indicate the data are not continuous (as opposed to histograms, where the bins touch each other). Error bars are not required for this type of plot. A bar chart can however be stacked or grouped to identify different (sub)-groups.
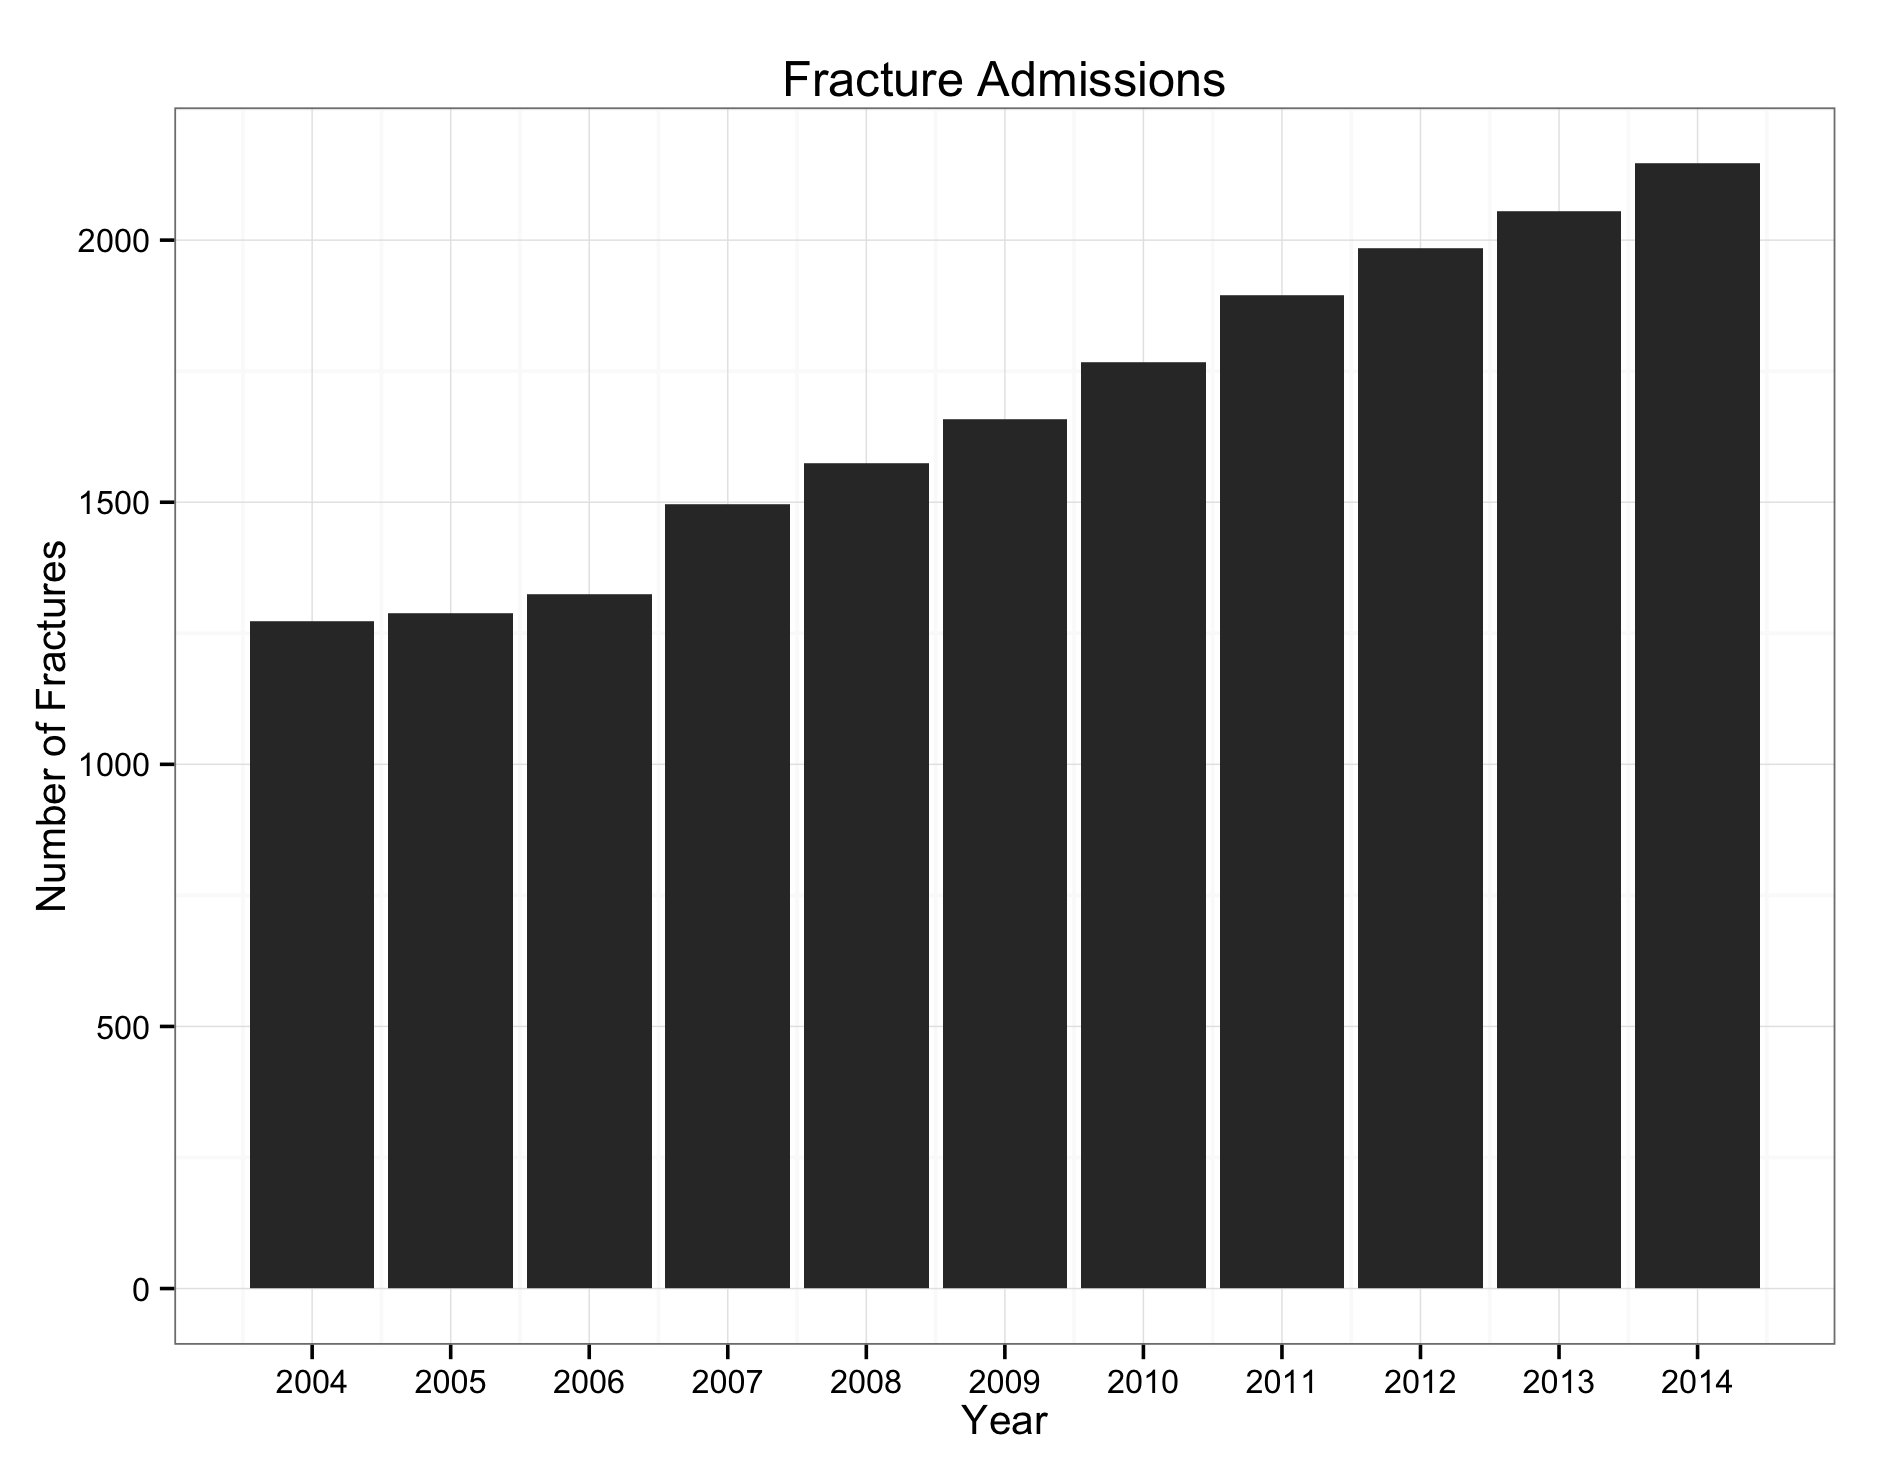
Download and open the plotbar.rda dataset for this example. This data set gives the number of patients admitted to an orthopaedic department that had a fracture over a ten year period (fictional data).
Plot builder can be used to create this plot, but here the instructions are typed into the console. To show the data:
plotbar
year fractures
1 2004 1273
2 2005 1289
3 2006 1325
4 2007 1497
5 2008 1575
6 2009 1658
7 2010 1767
8 2011 1895
9 2012 1984
10 2013 2055
11 2014 2146
Or to show each variable separately:
plotbar$year
[1] 2004 2005 2006 2007 2008 2009 2010 2011 2012 2013 2014
plotbar$fractures
[1] 1273 1289 1325 1497 1575 1658 1767 1895 1984 2055 2146
Use the ggplot() function to plot the bar chart. The easiest way to do this is by giving the plot a name and subsequently add instructions to it:
bar<-ggplot()+geom_bar(aes(x=year,y=fractures),data=plotbar,stat=’unique’)
bar
will show the plot.
To add a black and white theme add the theme to bar and show it again:
bar<-bar+theme_bw()
bar
To add a title:
bar<-bar+ ggtitle(label=’Fracture Admissions’)
bar
If you are using ggplot < 0.9.2, the title can be set by:
bar<-bar+ opts(title=’Fracture Admissions’)
bar
To set the x axis with yearly labels as defined in plotbar$year:
bar<-bar+scale_x_continuous(name=’Year’,breaks=plotbar$year)
bar
Similarly, the y axis can be set:
bar<-bar+scale_y_continuous(name=’Number of Fractures’)
bar
For the creation of more complex stacked bar charts and faceted bar charts, please refer to Advanced Concepts.