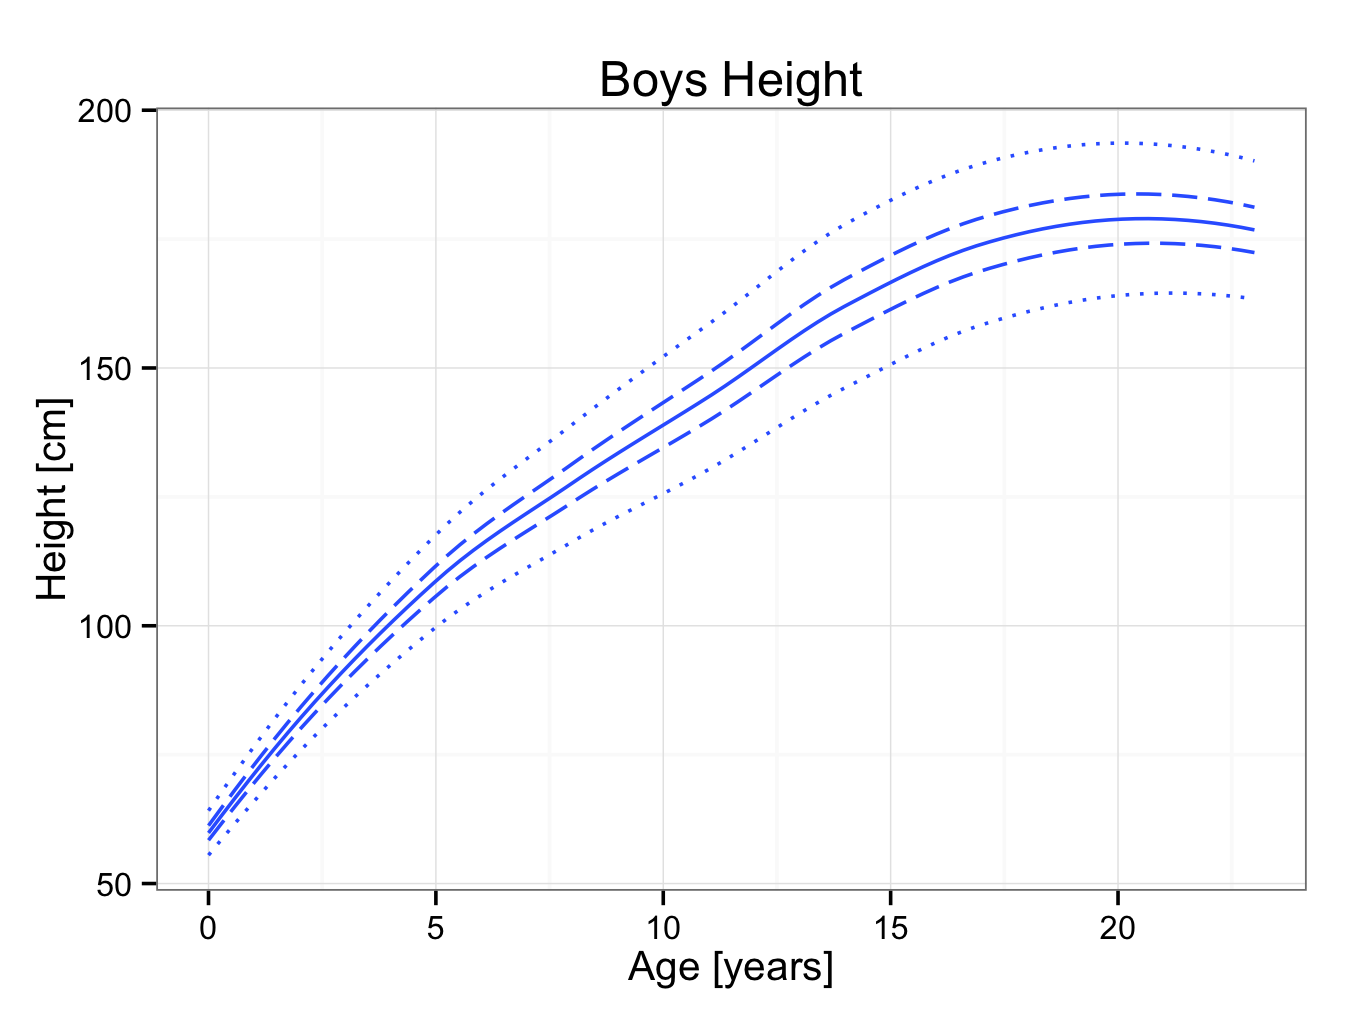
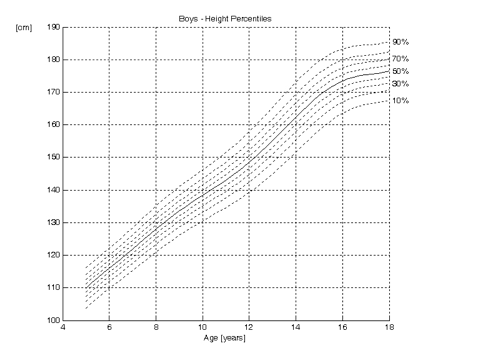
Below are typical growth curves for boys:
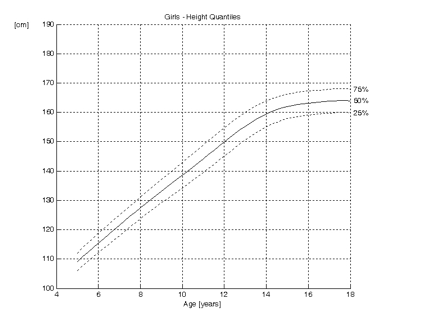
 And Girls:
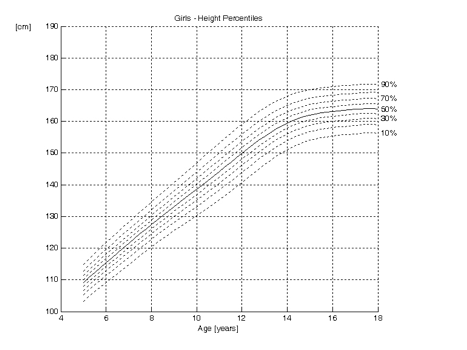 The curves show the height as function of the age for boys and girls.
The dotted lines are the percentiles. They indicate the proportion of children that are below a certain height. Ten per cent of the children are below the 10th percentile in height and consequently 90% are above it. Similarly, 30 per cent of the children are below the 30th percentile and 70 per cent above it. Also, 70 per cent are below the 70th percentile and 30 per cent above it.
The 50th percentile is shown as a solid line. Indeed, 50 per cent of the children are taller than the 50th percentile and 50 per cent shorter. It can be demonstrated that height is normally distributed. Therefore, in growth curves, the 50th percentile (P50) is the same as the mean (average), mode and the median.
P50 = mean = mode = median
It can be read from the growth curves above, that the mean final height for boys is approximately 176 cm, whilst this is 164 cm for girls. Twelve year old girls are on average 150 cm tall, whilst boys this age are approximately 148 cm. From these curves, it can also be seen that girls reach skeletal maturity earlier than boys. The curve for girls reaches a plateau at 15 years of age, whilst this is approximately 17 years for boys.
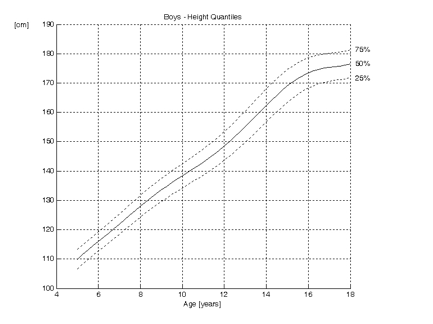
Quantiles are similar to percentiles. As the name implies, quantiles divide the data in four groups. The first quantile is at 25%, the second at 50%, the third at 75% and the fourth at 100%. So, the 25th percentile is the same as the first quantile. The 2nd quantile line is the same as the 50th percentile, the median, mode and median.
P50 = mean = mode = median = 2nd quantile
Growth curves with quantiles are shown below; only the 1st, 2nd and 3rd quantiles are shown:
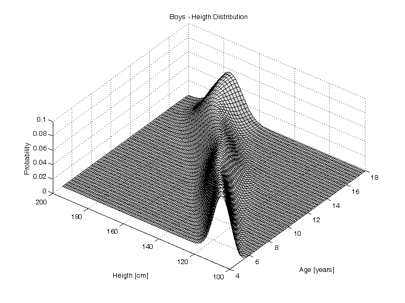
 As stated previously, height is normally distributed. At any particular age, the percentiles show a Gaussian or bell shaped curve. The growth charts are a continuum of Gaussian curves. This is shown three dimensionally below:

In normally distributed data, 68.27% of the data lie in an interval plus or minus one standard deviation from the mean. Similarly 95.45% of the data lie in an interval plus or minus twice the standard deviation and 99.73% of the data within an interval plus or minus three times the standard deviation.
Or:
Mean + / – 1 × SD = 68.27 %
Mean + / – 2 × SD = 95.45 %
Mean + / – 3 × SD = 99.73 %
To ‘translate’ this into percentiles:
One standard deviation about the mean:
68.27 % about the mean (P50) is the interval between
50 – (68.27 / 2) = 50 – 34.135 = 15.865 » 16th percentile
and
50 + (68.27 / 2) = 50 + 34.135 = 84.135 » 84th percentile
Similarly, two standard deviations about the mean:
50 – (95.45 / 2) = 50 – 47.725 = 2.275 » 2nd percentile
and
50 + (95.45 / 2) = 50 + 47.725 = 97.725 » 98th percentile
And three:
50 – (99.73 / 2) = 50 – 49.865 = 0.135 » 0.1th percentile
and
50 + (99.73 / 2) = 50 + 49.865 = 99.865 » 99.9th percentile
In summary:
Mean + / – 1 × SD = 68.27 % : between 16th and 84th percentile
Mean + / – 2 × SD = 95.45 % : between 2nd and 98th percentile
Mean + / – 3 × SD = 99.73 % : between 0.1th and 99.9th percentile
In JGR / R:
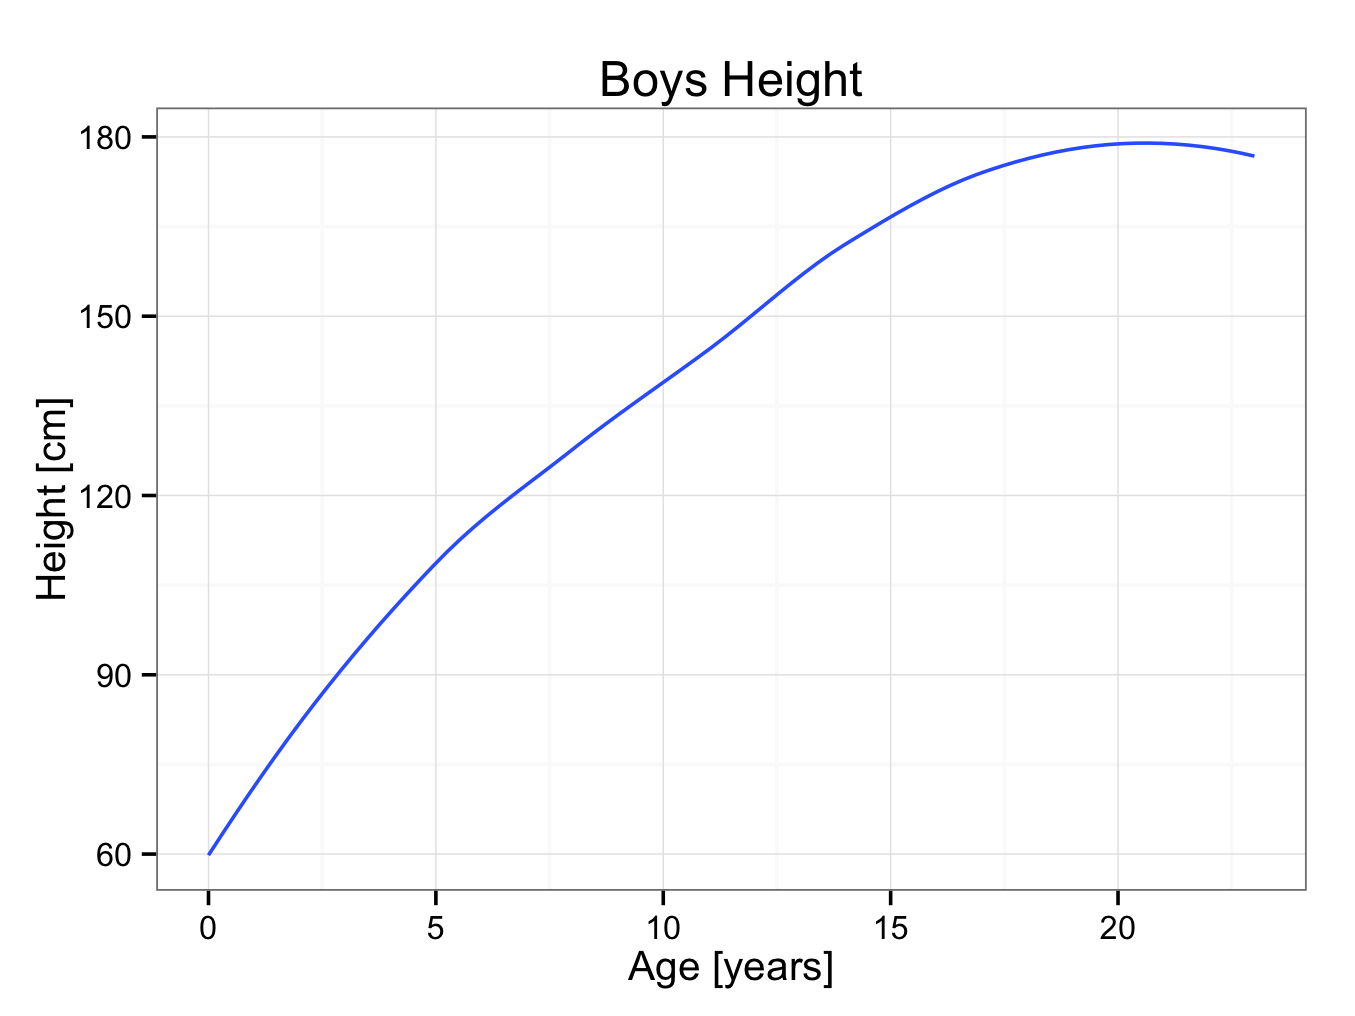
Sample data abstracted from the UK 1990 growth data are provided in malegrowth.rda. Plot builder can be used to construct a growth chart based on these data using the geom_smooth (Loess) best fit lines. Each line is added to a plot:
myplot<-ggplot() + theme_bw() +ggtitle(label = ‘Boys Height’)+ xlab(label = ‘Age [years]’) + ylab(label = ‘Height [cm]’) + geom_smooth(aes(x = year,y = X50th),data=male,se = FALSE)
myplot
This will create a plot with the mean height for boys:
It is easy to add the 2nd, 98th, 25th and 75th percentiles:
myplot<-myplot+geom_smooth(aes(x = year,y = X2nd),data=male,linetype = 3,se = FALSE)+geom_smooth(aes(x = year,y = X98th),data=male,linetype = 3,se = FALSE)+geom_smooth(aes(x = year,y = X25th),data=male,linetype = 5,se = FALSE)+geom_smooth(aes(x = year,y = X75th),data=male,linetype = 5,se = FALSE)
myplot