BioCircos 1 creates html pages. For example, without any arguments (from the examples):
library(BioCircos)
# https://cran.r-project.org/web/packages/BioCircos/vignettes/BioCircos.html
## have a look at the multitrack example at the end!!!
BioCircos()

Using hg19
BioCircos(genome = “hg19″, yChr = FALSE, genomeFillColor = “Reds”, chrPad = 0,
displayGenomeBorder = FALSE, genomeTicksDisplay = FALSE, genomeLabelDy = 0)

Custom
myGenome = list(“A” = 10560,
“B” = 8808,
“C” = 12014,
“D” = 7664,
“E” = 9403,
“F” = 8661)
BioCircos(genome = myGenome, genomeFillColor = c(“tomato2″, “darkblue”),
genomeTicksScale = 4e+3)

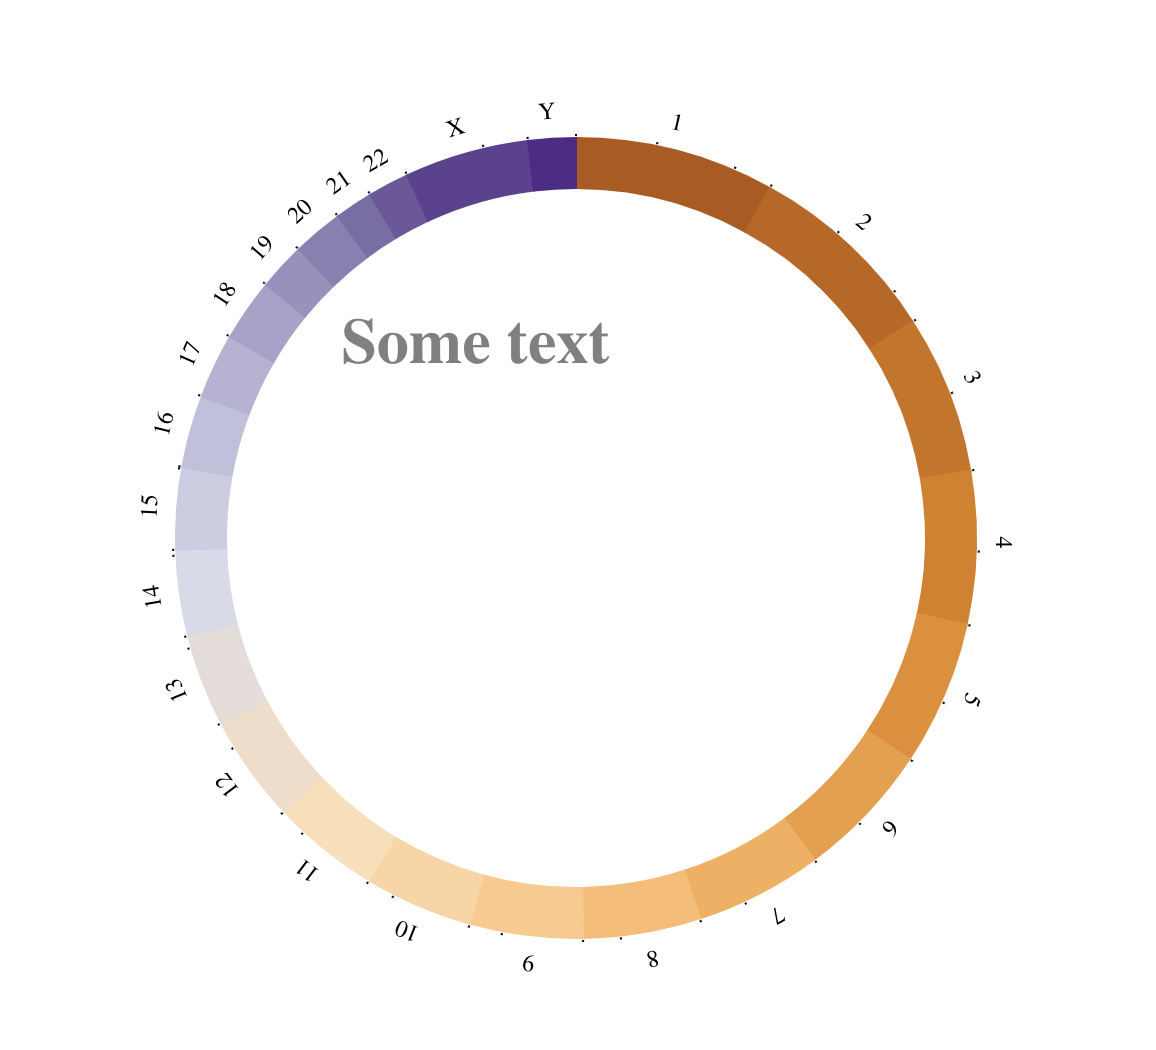
Text
tracklist = BioCircosTextTrack(‘myTextTrack’, ‘Some text’, size = “2em”, opacity = 0.5,
x = -0.67, y = -0.5)
BioCircos(tracklist, genomeFillColor = “PuOr”,
chrPad = 0, displayGenomeBorder = FALSE,
genomeTicksLen = 2, genomeTicksTextSize = 0, genomeTicksScale = 1e+8,
genomeLabelTextSize = “9pt”, genomeLabelDy = 0)
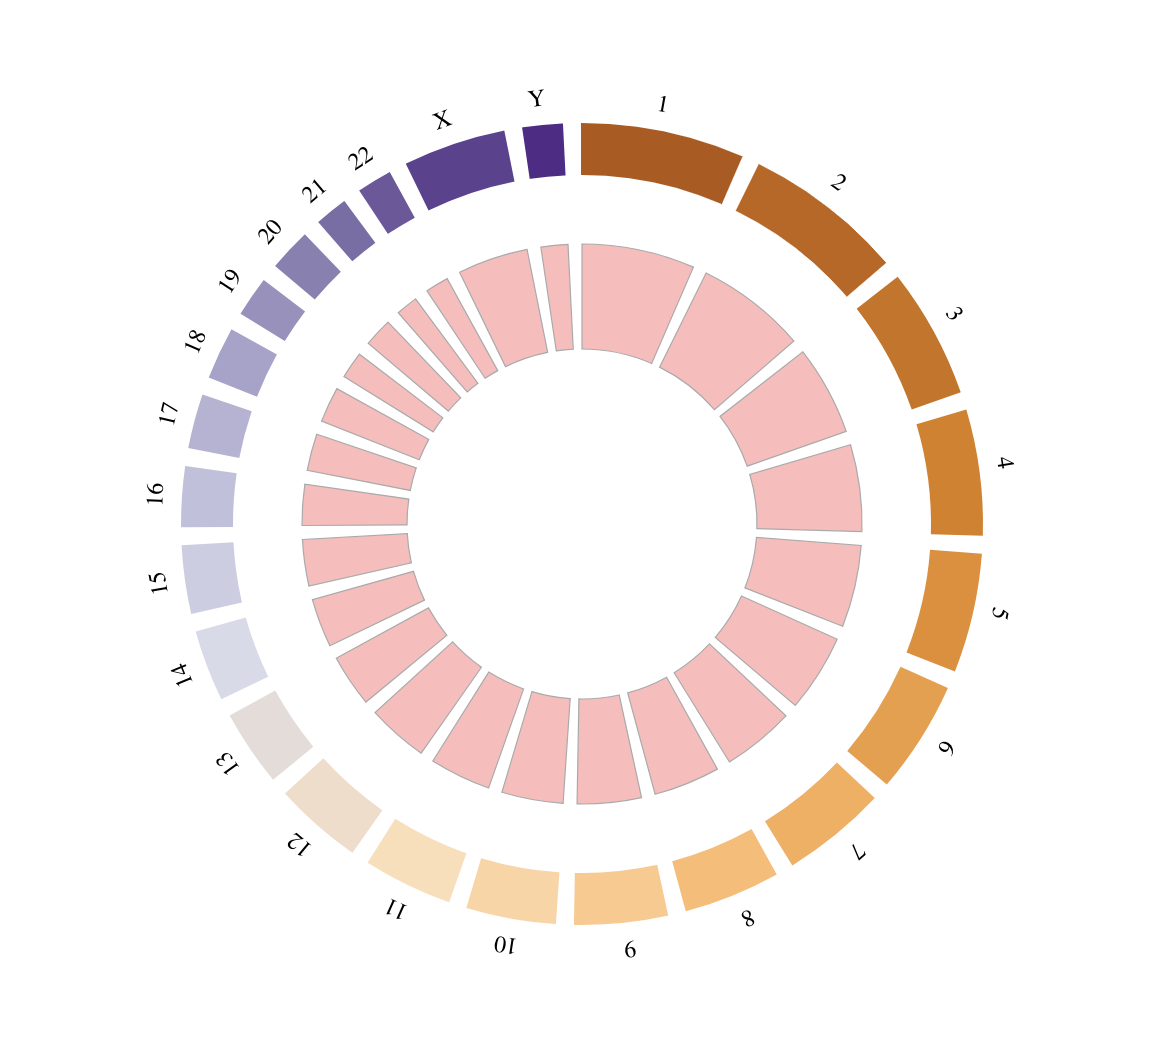
Background
tracklist = BioCircosBackgroundTrack(“myBackgroundTrack”, minRadius = 0.5, maxRadius = 0.8,
borderColors = “#AAAAAA”, borderSize = 0.6, fillColors = “#FFBBBB”)
BioCircos(tracklist, genomeFillColor = “PuOr”,
chrPad = 0.05, displayGenomeBorder = FALSE,
genomeTicksDisplay = FALSE, genomeLabelTextSize = “9pt”, genomeLabelDy = 0)
SNP track
# Chromosomes on which the points should be displayed
points_chromosomes = c(‘X’, ‘2’, ‘7’, ’13’, ‘9’)
# Coordinates on which the points should be displayed
points_coordinates = c(102621, 140253678, 98567307, 28937403, 20484611)
# Values associated with each point, used as radial coordinate
# on a scale going to minRadius for the lowest value to maxRadius for the highest value
points_values = 0:4
tracklist = BioCircosSNPTrack(‘mySNPTrack’, points_chromosomes, points_coordinates,
points_values, colors = c(“tomato2″, “darkblue”), minRadius = 0.5, maxRadius = 0.9)
# Background are always placed below other tracks
tracklist = tracklist + BioCircosBackgroundTrack(“myBackgroundTrack”,
minRadius = 0.5, maxRadius = 0.9,
borderColors = “#AAAAAA”, borderSize = 0.6, fillColors = “#B3E6FF”)
BioCircos(tracklist, genomeFillColor = “PuOr”,
chrPad = 0.05, displayGenomeBorder = FALSE, yChr = FALSE,
genomeTicksDisplay = FALSE, genomeLabelTextSize = 18, genomeLabelDy = 0)

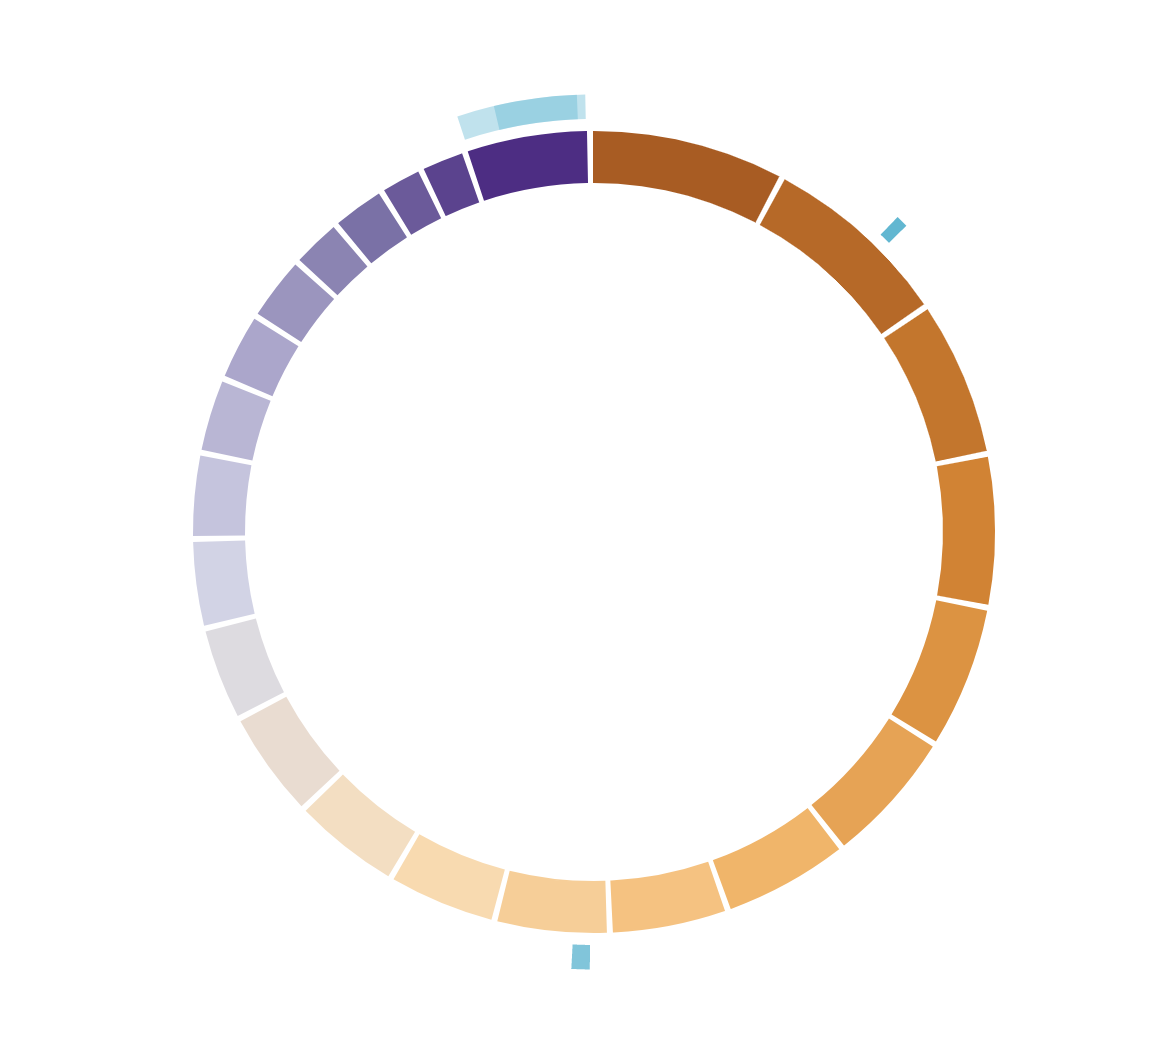
Arc track
# Chromosomes on which the arcs should be displayed
arcs_chromosomes = c(‘X’, ‘X’, ‘2’, ‘9’)
arcs_begin = c(1, 45270560, 140253678, 20484611)
arcs_end = c(155270560, 145270560, 154978472, 42512974)
tracklist = BioCircosArcTrack(‘myArcTrack’, arcs_chromosomes, arcs_begin, arcs_end,
minRadius = 1.18, maxRadius = 1.25, opacities = c(0.4, 0.4, 1, 0.8))
BioCircos(tracklist, genomeFillColor = “PuOr”,
chrPad = 0.02, displayGenomeBorder = FALSE, yChr = FALSE,
genomeTicksDisplay = FALSE, genomeLabelTextSize = 0)
Link track
links_chromosomes_1 = c(‘X’, ‘2’, ‘9’) # Chromosomes on which the links should start
links_chromosomes_2 = c(‘3′, ’18’, ‘9’) # Chromosomes on which the links should end
links_pos_1 = c(155270560, 154978472, 42512974)
links_pos_2 = c(102621477, 140253678, 20484611)
links_labels = c(“Link 1″, “Link 2″, “Link 3″)
tracklist = BioCircosBackgroundTrack(“myBackgroundTrack”, minRadius = 0, maxRadius = 0.55,
borderSize = 0, fillColors = “#EEFFEE”)
tracklist = tracklist + BioCircosLinkTrack(‘myLinkTrack’, links_chromosomes_1, links_pos_1,
links_pos_1 + 50000000, links_chromosomes_2, links_pos_2, links_pos_2 + 750000,
maxRadius = 0.55, labels = links_labels)
BioCircos(tracklist, genomeFillColor = “PuOr”,
chrPad = 0.02, displayGenomeBorder = FALSE, yChr = FALSE,
genomeTicksDisplay = FALSE, genomeLabelTextSize = “8pt”, genomeLabelDy = 0)

Bar track
library(RColorBrewer)
library(grDevices)
# Define a custom genome
genomeChr = LETTERS
lengthChr = 5*1:length(genomeChr)
names(lengthChr) <- genomeChr
tracks = BioCircosTracklist()
# Add one track for each chromosome
for (i in 1:length(genomeChr)){
# Define histogram/bars to be displayed
nbBars = lengthChr[i] – 1
barValues = sapply(1:nbBars, function(x) 10 + nbBars%%x)
barColor = colorRampPalette(brewer.pal(8, “YlOrBr”))(length(genomeChr))[i]
# Add a track with bars on the i-th chromosome
tracks = tracks + BioCircosBarTrack(paste0(“bars”, i), chromosome = genomeChr[i],
starts = (1:nbBars) – 1, ends = 1:nbBars, values = barValues, color = barColor,
range = c(5,75))
}
# Add background
tracks = tracks + BioCircosBackgroundTrack(“bars_background”, colors = “#2222EE”)
BioCircos(tracks, genomeFillColor = “YlOrBr”, genome = as.list(lengthChr),
genomeTicksDisplay = F, genomeLabelDy = 0)

CNV tracks
# Arcs coordinates
snvChr = rep(4:9, 3)
snvStart = c(rep(1,6), rep(40000000,6), rep(100000000,6))
snvEnd = c(rep(39999999,6), rep(99999999,6),
191154276, 180915260, 171115067, 159138663, 146364022, 141213431)
# Values associated with each point, used as radial coordinate
# on a scale going to minRadius for the lowest value to maxRadius for the highest value
snvValues = (1:18%%5)+1
# Create CNV track
tracks = BioCircosCNVTrack(‘cnv_track’, as.character(snvChr), snvStart, snvEnd, snvValues,
color = “#CC0000″, range = c(0,6))
# Add background
tracks = tracks + BioCircosBackgroundTrack(“arcs_background”, colors = “#2222EE”)
BioCircos(tracks, genomeFillColor = “YlOrBr”, genomeTicksDisplay = F, genomeLabelDy = 0)

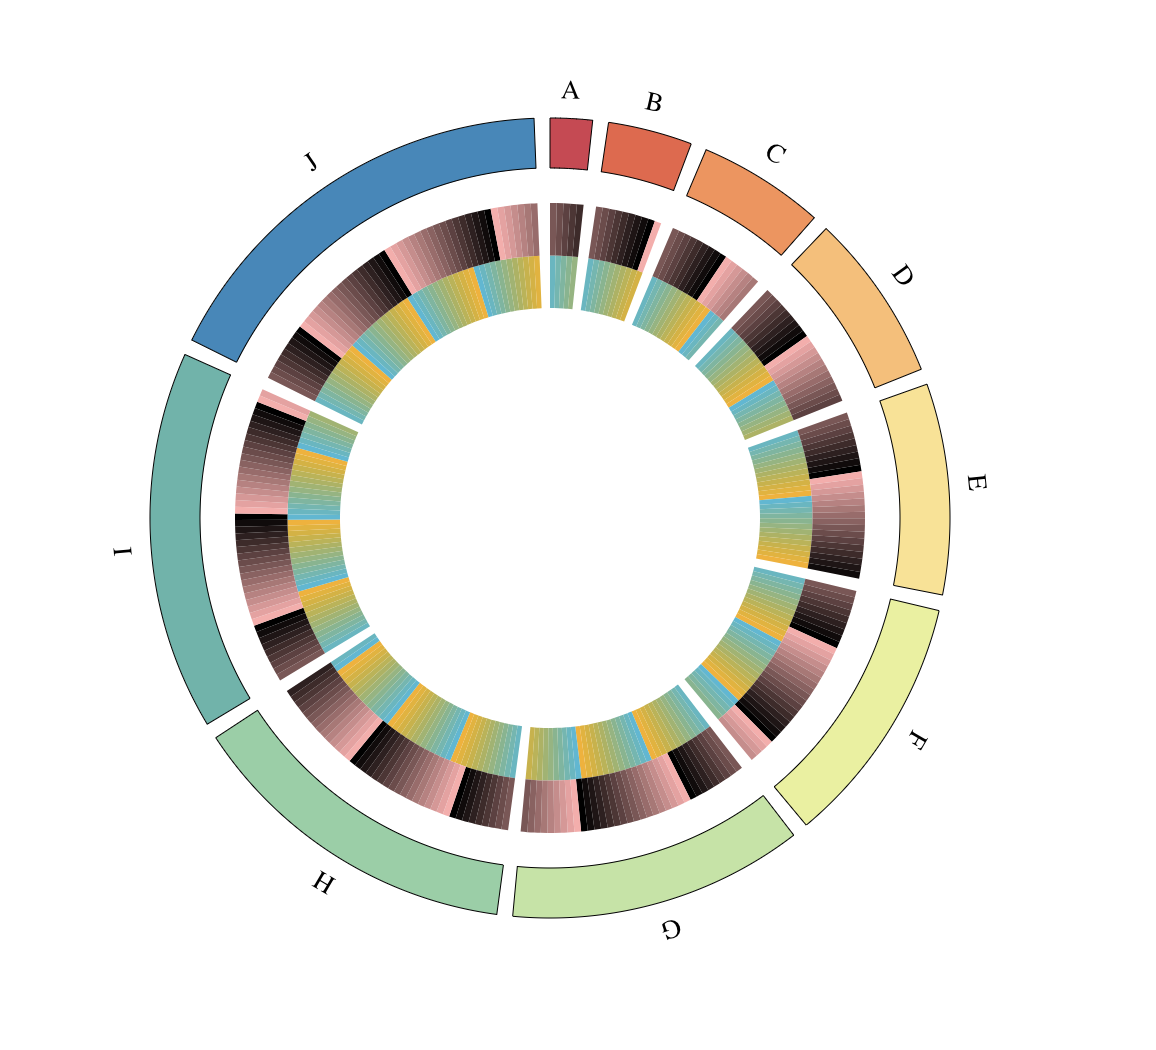
Heatmap tracks
# Define a custom genome
genomeChr = LETTERS[1:10]
lengthChr = 5*1:length(genomeChr)
names(lengthChr) <- genomeChr
# Define boxes positions
boxPositions = unlist(sapply(lengthChr, seq))
boxChromosomes = rep(genomeChr, lengthChr)
# Define values for two heatmap tracks
boxVal1 = boxPositions %% 13 / 13
boxVal2 = (7 + boxPositions) %% 17 / 17
tracks = BioCircosHeatmapTrack(“heatmap1″, boxChromosomes, boxPositions – 1, boxPositions,
boxVal1, minRadius = 0.6, maxRadius = 0.75)
tracks = tracks + BioCircosHeatmapTrack(“heatmap1″, boxChromosomes, boxPositions – 1,
boxPositions, boxVal2, minRadius = 0.75, maxRadius = 0.9, color = c(“#FFAAAA”, “#000000″))
BioCircos(tracks, genome = as.list(lengthChr), genomeTicksDisplay = F, genomeLabelDy = 0,
HEATMAPMouseOverColor = “#F3C73A”)
Line tracks
chrVert = rep(c(1, 3, 5), c(20,10,5))
posVert = c(249250621*log(c(20:1, 10:1, 5:1), base = 20))
tracks = BioCircosLineTrack(‘LineTrack’, as.character(chrVert), posVert, values = cos(posVert))
tracks = tracks + BioCircosLineTrack(‘LineTrack2′, as.character(chrVert+1), 0.95*posVert,
values = sin(posVert), color = “#40D4B9″)
tracks = tracks + BioCircosBackgroundTrack(‘Bg’, fillColors = ‘#FFEEBB’, borderSize = 0)
BioCircos(tracks, chrPad = 0.05, displayGenomeBorder = FALSE, LINEMouseOutDisplay = FALSE,
LINEMouseOverTooltipsHtml01 = “Pretty lines<br/>COOL!”)

Multi-track example
# Fix random generation for reproducibility
set.seed(3)
# SNP tracks
tracks = BioCircosSNPTrack(“testSNP1″, as.character(rep(1:10,10)),
round(runif(100, 1, 135534747)),
runif(100, 0, 10), colors = “Spectral”, minRadius = 0.3, maxRadius = 0.45)
tracks = tracks + BioCircosSNPTrack(“testSNP2″, as.character(rep(1:15,5)),
round(runif(75, 1, 102531392)),
runif(75, 2, 12), colors = c(“#FF0000″, “#DD1111″, “#BB2222″, “#993333″),
maxRadius = 0.8, range = c(2,12))
# Overlap point of interest on previous track, fix range to use a similar scale
tracks = tracks + BioCircosSNPTrack(“testSNP3″, “7”, 1, 9, maxRadius = 0.8, size = 6,
range = c(2,12))
# Background and text tracks
tracks = tracks + BioCircosBackgroundTrack(“testBGtrack1″, minRadius = 0.3, maxRadius = 0.45,
borderColors = “#FFFFFF”, borderSize = 0.6)
tracks = tracks + BioCircosBackgroundTrack(“testBGtrack2″, borderColors = “#FFFFFF”,
fillColor = “#FFEEEE”, borderSize = 0.6, maxRadius = 0.8)
tracks = tracks + BioCircosTextTrack(“testText”, ‘BioCircos!’, weight = “lighter”,
x = – 0.17, y = – 0.87)
# Arc track
arcsEnds = round(runif(7, 50000001, 133851895))
arcsLengths = round(runif(7, 1, 50000000))
tracks = tracks + BioCircosArcTrack(“fredTestArc”, as.character(sample(1:12, 7, replace=T)),
starts = arcsEnds – arcsLengths, ends = arcsEnds, labels = 1:7,
maxRadius = 0.97, minRadius = 0.83)
# Link tracks
linkPos1 = round(runif(5, 1, 50000000))
linkPos2 = round(runif(5, 1, 50000000))
chr1 = sample(1:22, 5, replace = T)
chr2 = sample(1:22, 5, replace = T)
linkPos3 = round(runif(5, 1, 50000000))
linkPos4 = round(runif(5, 1, 50000000))
chr3 = sample(1:22, 5, replace = T)
chr4 = sample(1:22, 5, replace = T)
tracks = tracks + BioCircosLinkTrack(“testLink”, gene1Chromosomes = chr1,
gene1Starts = linkPos1, gene1Ends = linkPos1+1, gene2Chromosomes = chr2, axisPadding = 6,
color = “#EEEE55″, width = “0.3em”, labels = paste(chr1, chr2, sep = “*”), displayLabel = F,
gene2Starts = linkPos2, gene2Ends = linkPos2+1, maxRadius = 0.42)
tracks = tracks + BioCircosLinkTrack(“testLink2″, gene1Chromosomes = chr3,
gene1Starts = linkPos3, gene1Ends = linkPos3+5000000, axisPadding = 6, displayLabel = F,
color = “#FF6666″, labels = paste(chr3, chr4, sep = “-“), gene2Chromosomes = chr4,
gene2Starts = linkPos4, gene2Ends = linkPos4+2500000, maxRadius = 0.42)
# Display the BioCircos visualization
BioCircos(tracks, genomeFillColor = “Spectral”, yChr = T, chrPad = 0, displayGenomeBorder = F,
genomeTicksLen = 3, genomeTicksTextSize = 0, genomeTicksScale = 50000000,
genomeLabelTextSize = 18, genomeLabelDy = 0)
