A sunflower plot is a special type of scatterplot. It is particularly useful for high density data. When plotted, high density data points will be plotted on top of each other, making the plot difficult to interpret as it is uncertain how many data points are plotted.
For example, consider the following data frame sun.rda with 21 observations:
sun
X Y
1 0.5 0.75
2 0.9 0.92
3 0.9 0.92
4 1.1 1.50
5 1.1 1.50
6 1.1 1.50
7 1.7 1.85
8 1.7 1.85
9 1.7 1.85
10 1.7 1.85
11 1.9 2.40
12 1.9 2.40
13 1.9 2.40
14 1.9 2.40
15 1.9 2.40
16 2.2 2.70
17 2.2 2.70
18 2.2 2.70
19 2.2 2.70
20 2.2 2.70
21 2.2 2.70
To create a simple scatterplot using base R:
plot(sun)

This plot suggests there are only 6 data points, whilst in fact there are 21. The data points are plotted on top of each other as they have the same value (there is a high density). A sunflower plot is a better option as it shows there are 21 data points:
sunflowerplot(sun)
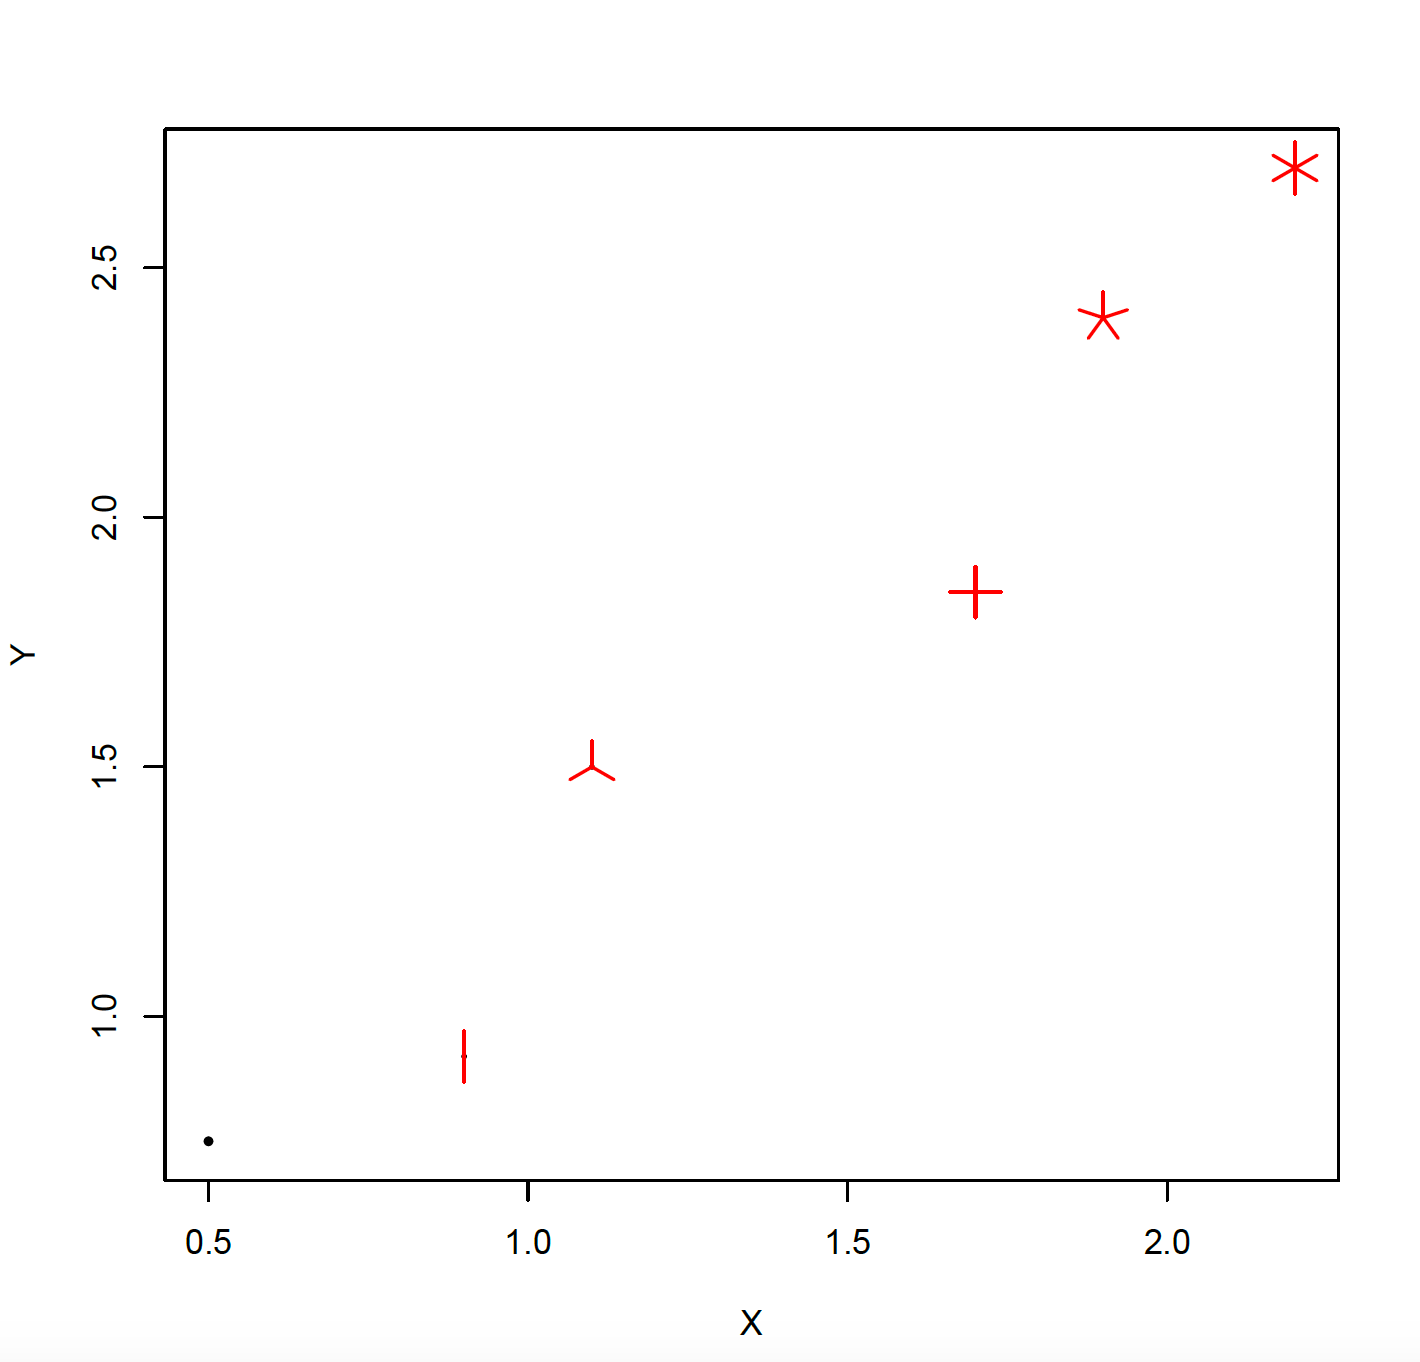
The density of the data is much easier to appreciate. In the sunflower plot, each petal represents a single observation.