A strip plot is a simple way of visualising numerical data in different categories. The plot shows the distribution of the data for each category as individual datapoints. The categories are displayed on the x-axis and the strips are vertical parallel to the y-axis. The plot can be created with the ggplot2 1 package.
Download and open the strip.rda dataset for this example and open it in R / JGR. The data set contains the maximum flexion in 20 patients before and after a manipulation under anaesthesia. The data can be shown by:
strip
Flexion MUA
1 94 Pre
2 95 Pre
3 89 Pre
–
–
39 113 Post
40 86 Post
To create a simple strip plot:
library(ggplot2)
ggplot(strip, aes(x = MUA, y = Flexion)) + geom_jitter(position = position_jitter(0)) + theme_bw() + scale_x_discrete(limits = c(‘Pre’,’Post’))

The scale_x_discrete(limits = c(‘Pre’,’Post’) is required to plot ‘Pre’ to the left of ‘Post’ on the categorical x-axis.
It is easy to display the groups in different colours. If the points overlap, it can become difficult to see how many data points there are. By introducing jitter, all data points can be visualised and the plot becomes similar to a swarm or beeswarm plot.
library(ggplot2)
ggplot(strip, aes(x = MUA, y = Flexion, color = MUA)) + geom_jitter(position = position_jitter(0.2)) + theme_bw() + scale_x_discrete(limits = c(‘Pre’,’Post’)) + scale_color_manual(values = c(‘red’, ‘blue’)) + theme(legend.position = ‘none’)
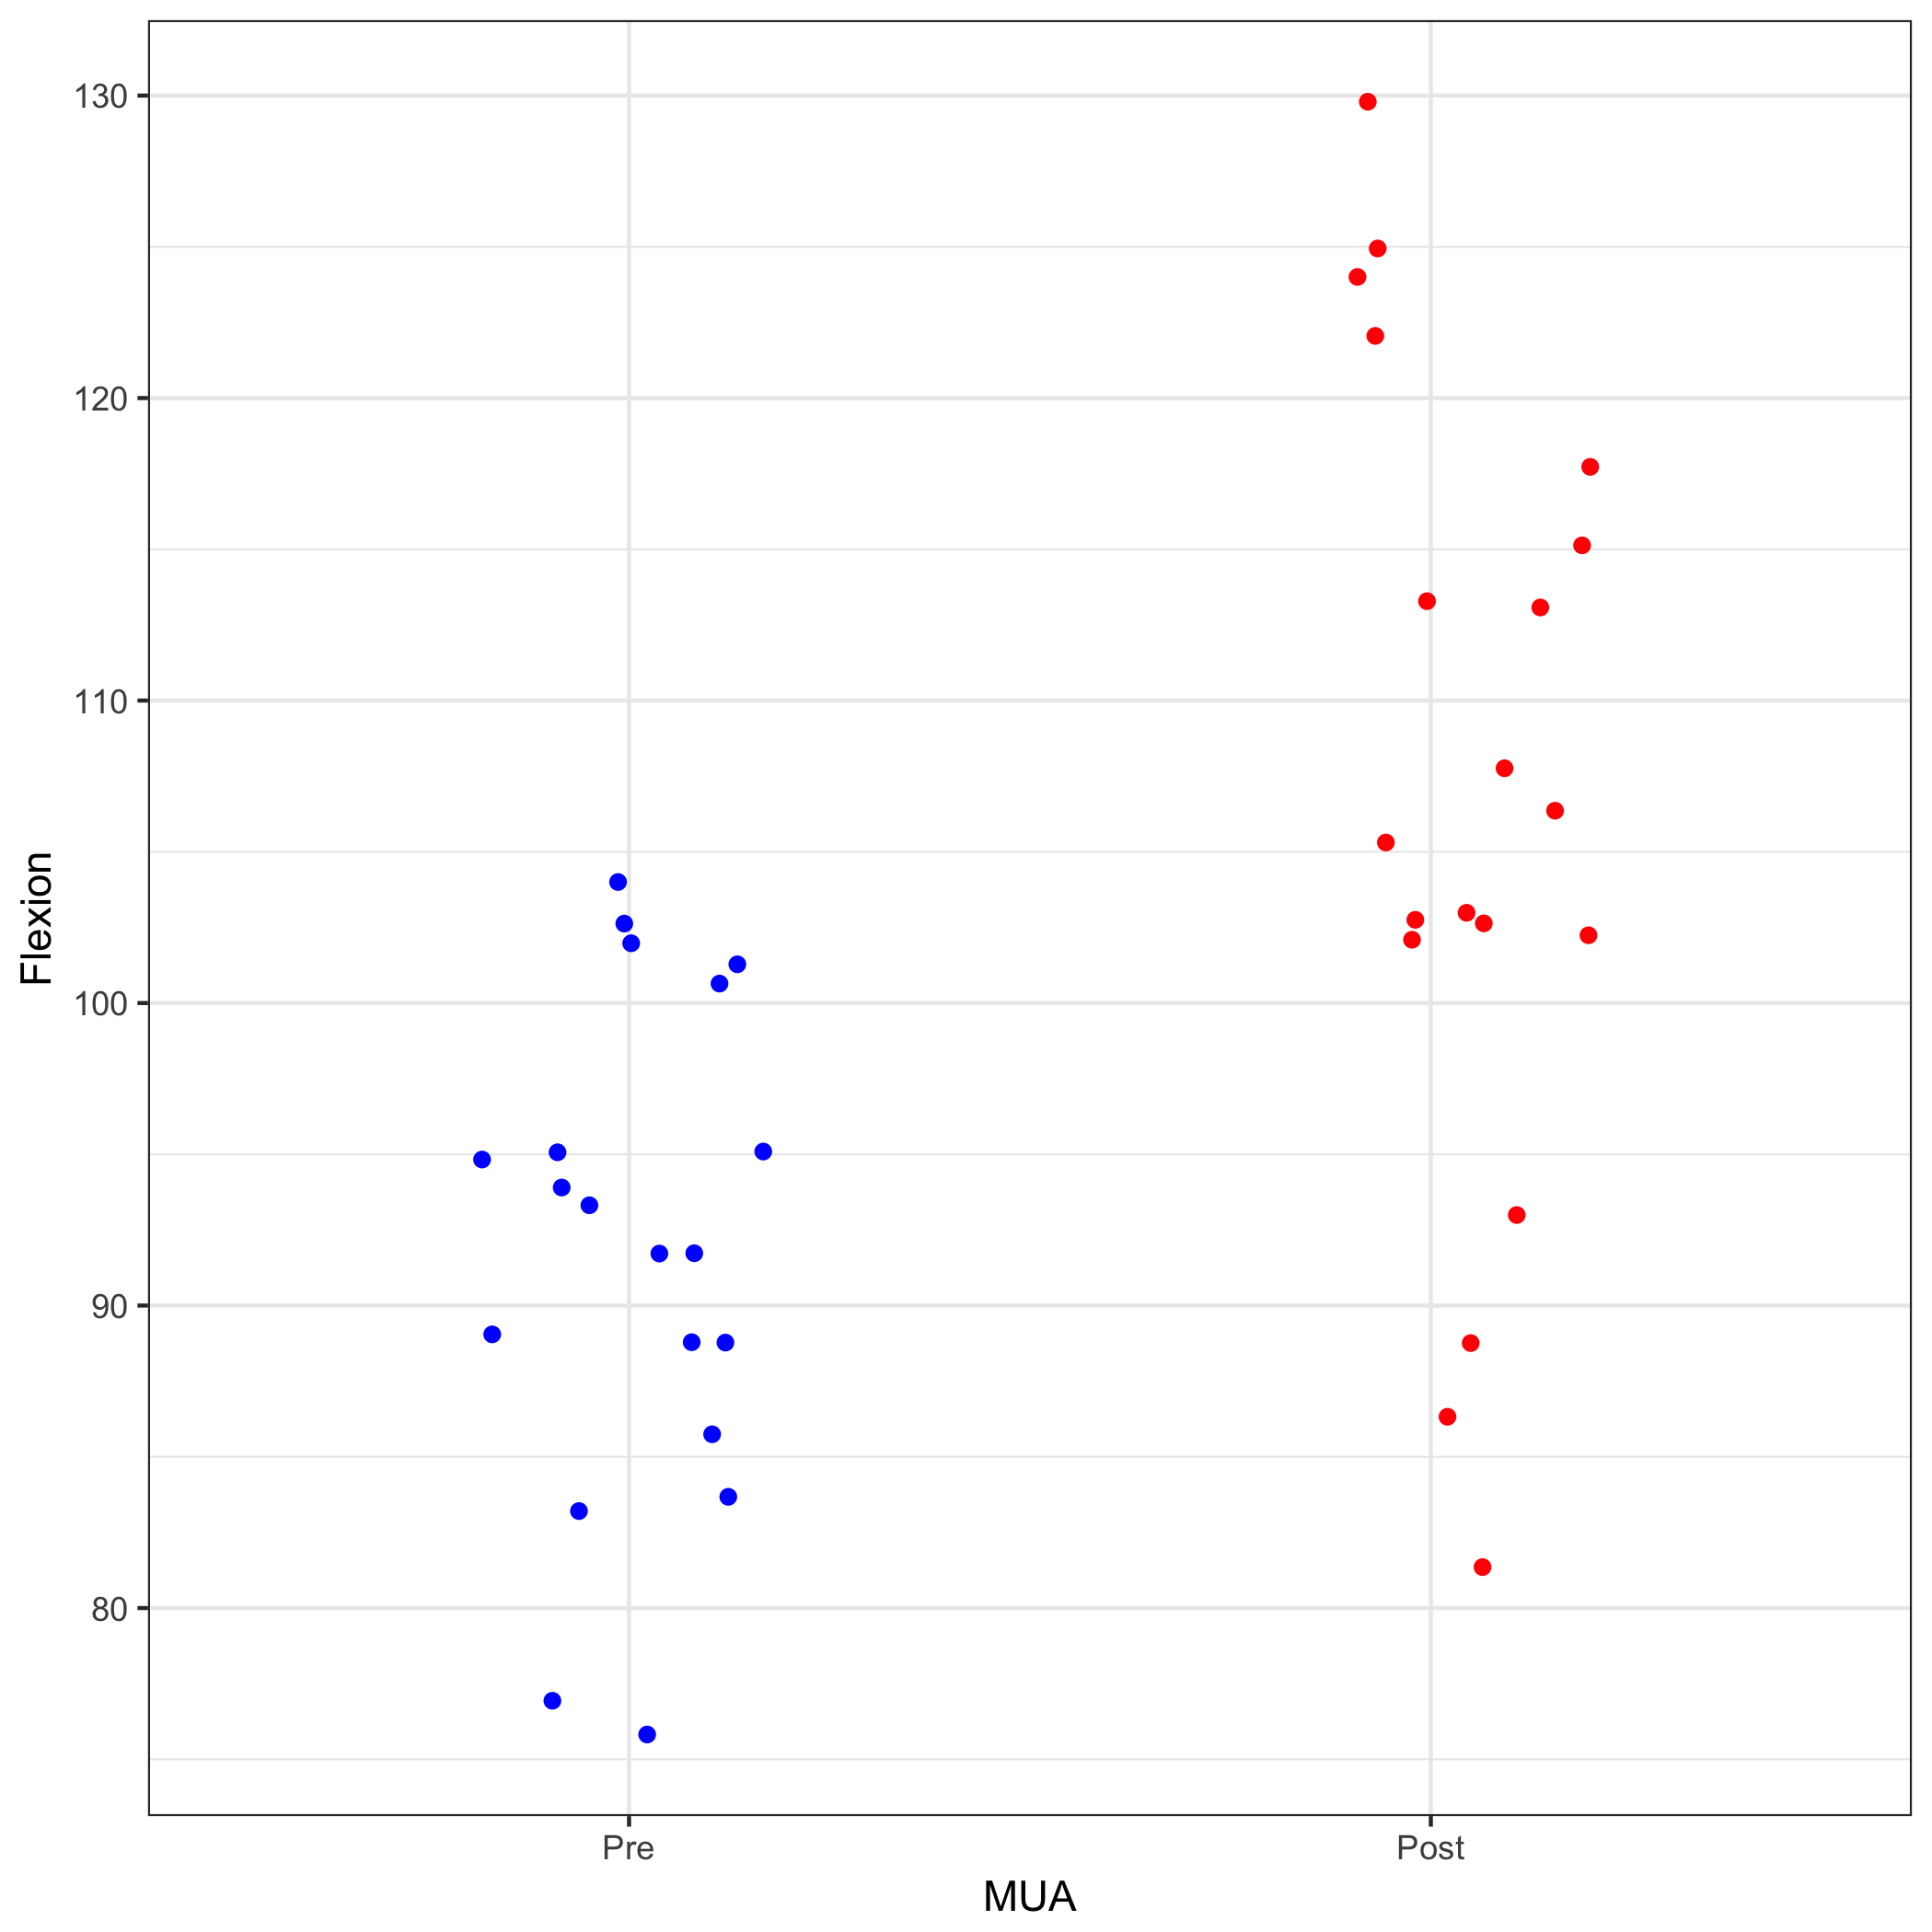
Please note the color = MUA maps the colour to the different categories. The colour is set manually with scale_color_manual(values = c(‘red’, ‘blue’)) and the legend is switch off with theme(legend.position = ‘none’).
It is possible to combine a strip plot with a box plot.
library(ggplot2)
ggplot(strip, aes(x = MUA, y = Flexion, color = MUA)) + geom_boxplot(color = ‘black’) + geom_jitter(position = position_jitter(0.2)) + theme_bw() + scale_x_discrete(limits = c(‘Pre’,’Post’)) + scale_color_manual(values = c(‘red’, ‘blue’)) + theme(legend.position = ‘none’)
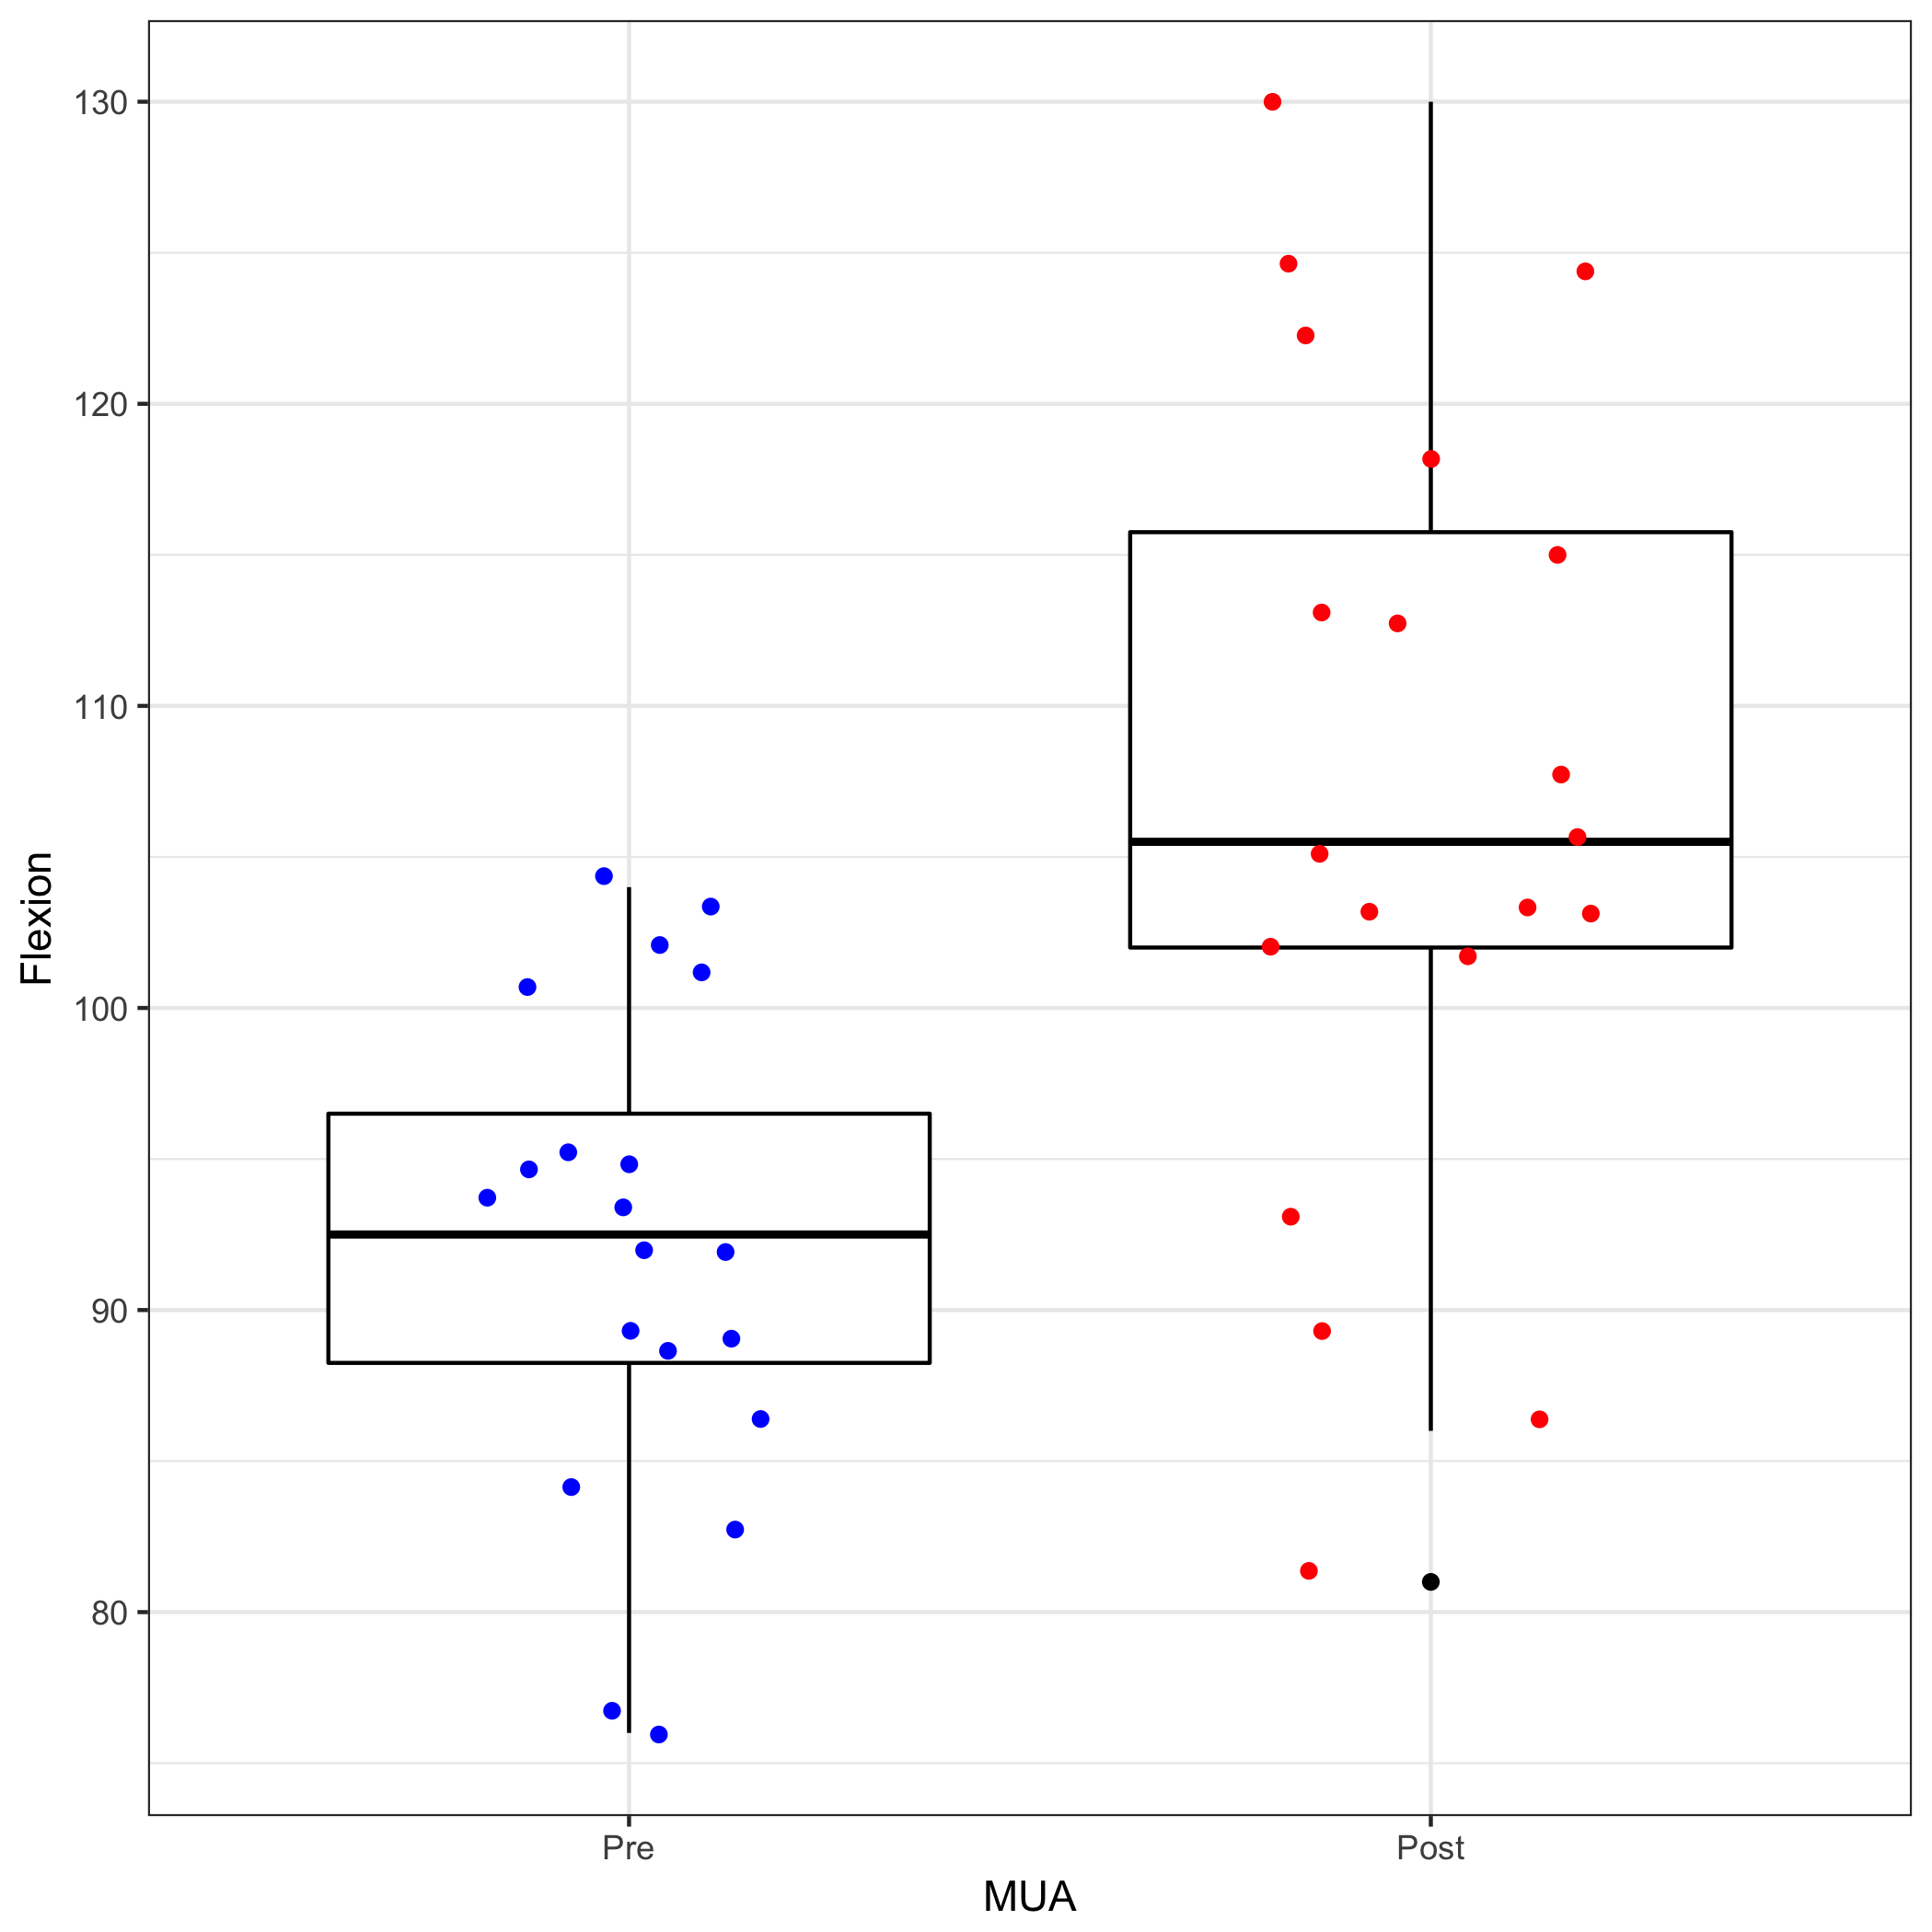
The geom_boxplot(color = ‘black’) call should be before the geom_jitter call to plot the boxplot first and overlay this with the data points.